How inFlow can recommend a reorder point for your products
inFlow has a report that can calculate this for you: Recommended Reorder Point report. As long as you have sales data in inFlow, we can use it to recommend effective reorder points for your items.
Web
Step 1: Set up vendor info (Lead Time)
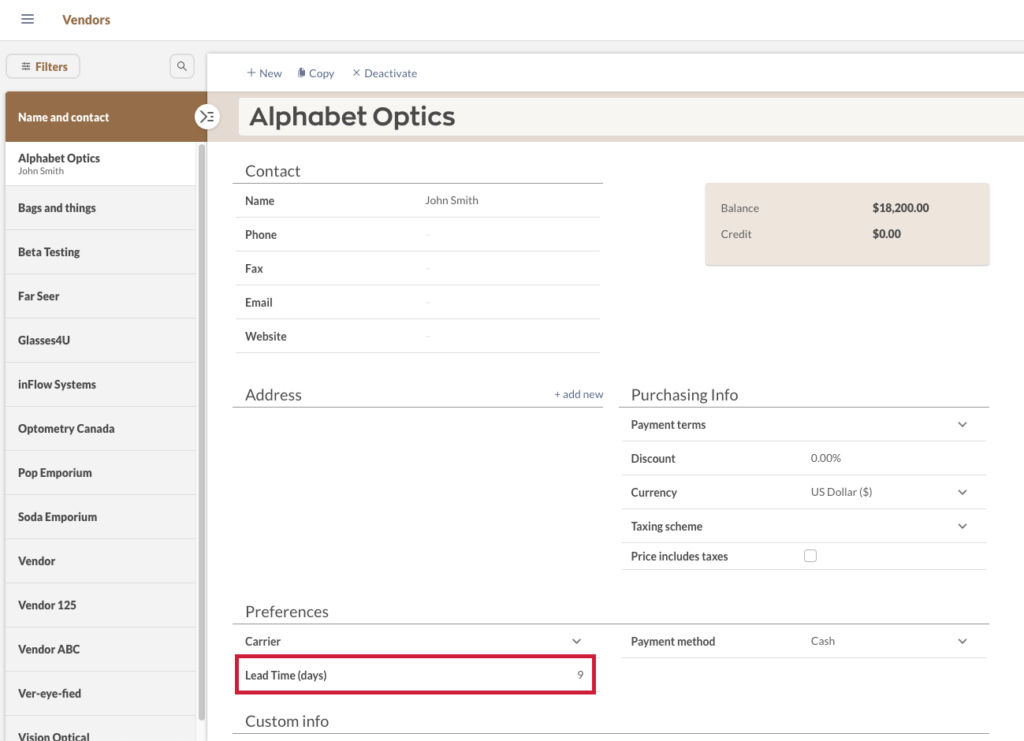
The first thing you’ll need to do is set up your vendor’s Lead Time in days. This field is under Preferences.
In general, Lead Time is the amount of time it takes for your vendor to ship items to you. To get the best estimate for inFlow, we recommend entering the total lead time (i.e., number of days to arrive + any additional days you spend waiting to order).
For instance, if it takes two days for ordered products to arrive, but you order weekly (rather than as needed), you’ll need to include your own wait time too. So, two days + seven days wait time = nine days total lead time.
Please note: this is meant to be a helpful guideline for reordering. After running the report, we recommend adjusting your reorder point to account for other factors that inFlow doesn’t currently track (e.g. seasonal demand).
Step 2: Generate the report
Now you can go to Main Menu > Reports > Inventory and scroll down to the Recommended Reorder Point.
You’ll notice there are two extra fields on the top filter area: Averaging Period (Days) and Safety Stock. We’ll go into more detail about them below.

Averaging Period (Days)
To calculate the reorder point, inFlow needs to find out your item’s demand (how fast your item has sold or been used in the past). This can change depending on the number of days you are looking at, so you’ll need to specify that in the Averaging Period (Days) field. We recommend 90 days as a starting point (i.e., one quarter of the year), but you can change the number of days if you prefer.
Safety Stock (percent)
Safety Stock is an additional amount of product that you maintain as a buffer to minimize the chance of selling out before the next shipment arrives. inFlow’s Safety Stock field is expressed as a percentage of your demand.
We suggest starting with safety stock at 50% (half of your demand). If you’re still running out of stock or find that you’re reordering too often, you can increase safety stock to 60% or 70%. If you’re regularly overstocked, you can lower safety stock to 30% or 40%.
Want more information on safety stock? You can read more about safety stock here.
Report columns
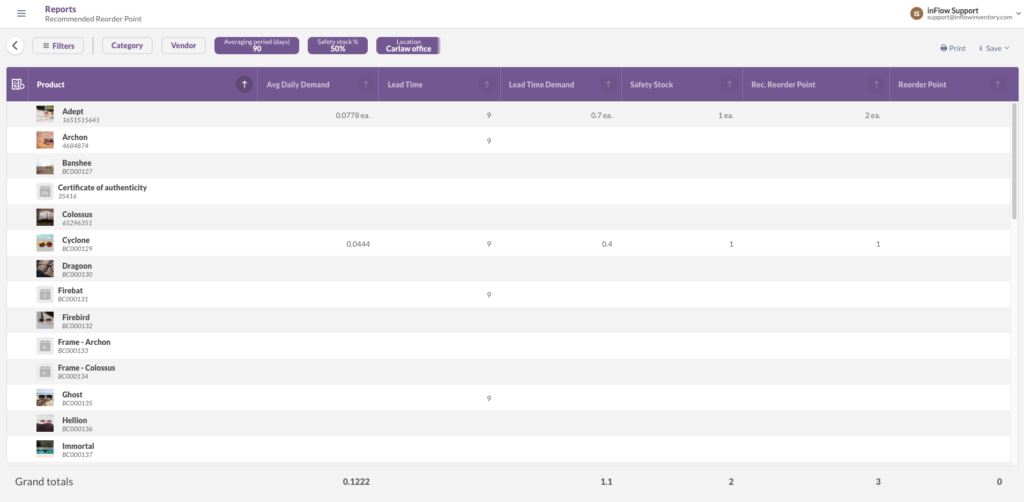
In the above example the report is defaulted to set the Averaging Period (Days) to 90, and Safety Stock to 50%.
Click Generate Report. You’ll see a list of columns and numbers.
The Avg daily demand is the amount sold (or used in a work order) over your chosen period of days.
Lead time is your vendor’s lead time as mentioned above. If you have multiple vendors for this item, it will show the lead time for the last vendor you purchased from.
Lead time demand is the amount sold or used before your next purchase order comes in. This is basically average daily demand multiplied by lead time.
Safety Stock, as mentioned above, is the extra amount in stock to reduce the risk of it running out. We’ve set it to 50% of the demand. For example, if our demand is calculated to be about 15.7 units, 50% of that is about 8 units (rounded up).
Finally, we arrive at the recommended reorder point. This is simply your lead-time demand plus safety stock. For example, that’s 15.7 plus 8, to give a recommended reorder point of 24 units (rounded up).
The final column is your current reorder point (called “Reorder Point“). It’s listed there so you can compare the recommended reorder point against the current reorder point.
Step 3: Adjust your reorder point
Now that you’ve got the numbers, here are some things to keep in mind:
This report only estimates how quickly your product sells based on historical demand. We encourage you to use your judgment to adjust your reorder point for each product.
For example, you should increase the reorder point above inFlow’s recommendation if you are forecasting increased sales (promotions, seasonal demand), or decrease the reorder point if you are forecasting a drop in sales (end of promotion, newer model was released).
If you’re seeing a blank or low recommended reorder point, it’s likely due to inFlow not having enough sales history for that item. If you’ve added a new product to the database and it’s only been selling for the past week, it’s unlikely that there would be enough information to calculate the average daily demand of the past 90 days.
Windows
Step 1: Set up vendor info (Lead Time)
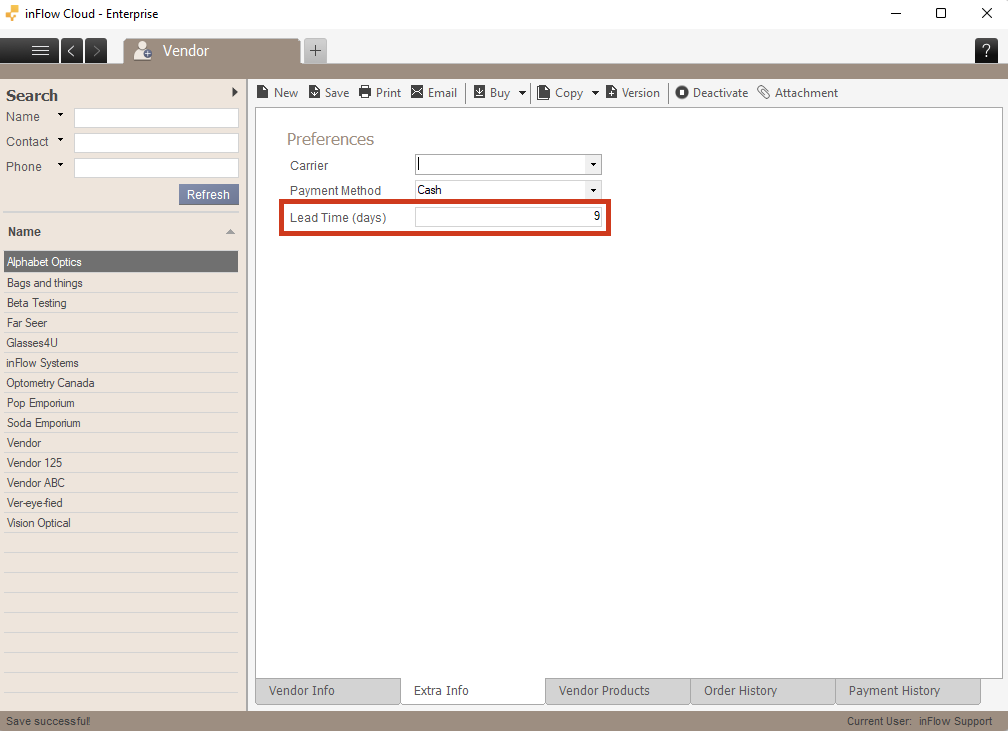
The first thing you’ll need to do is set up your vendor’s Lead Time in days. This field is in the vendor record’s Extra Info tab.
In general terms, Lead Time is the amount of time it takes for your vendor to ship items to you. To get the best estimate for inFlow, however, we recommend entering the total lead time (i.e., number of days to arrive + any additional days you spend waiting to order).
For instance, if it takes two days for ordered products to arrive, but you order weekly (rather than as needed), you’ll need to include your own wait time too. So, two days + seven days wait time = nine days total lead time.
Please note: this is meant to be a helpful guideline for reordering. After running the report, we recommend adjusting your reorder point to account for other factors that inFlow doesn’t currently track (e.g. seasonal demand)
Step 2: Generate the report
Now you can head to Main Menu > Reports > All Reports > Inventory Reports. Click on Recommended Reorder Point and set the products you want to include in this report.
You’ll notice there are two extra fields on the left under Options: Averaging Period (Days) and Safety Stock. We’ll go into more detail about them below.
Averaging Period (Days)
In order to calculate the reorder point, inFlow needs to find out your item’s demand (how fast your item has sold or used) in the past. This can change depending on the number of days you are looking at, so you’ll need to specify that in the Averaging Period (Days) field. We recommend 90 days as a starting point (i.e., one quarter of the year), but you can change the number of days if you prefer.
Safety Stock (percent)
Safety Stock is an additional amount of product that you maintain as a buffer to minimize the chance of selling out before the next shipment arrives. inFlow’s Safety Stock field is a expressed as a percentage of your demand.
We suggest starting with safety stock at 50 percent (half of your demand). If you’re still running out of stock or find that you’re reordering too often, you can increase safety stock to 60 or 70 percent. If you’re regularly overstocked, you can lower safety stock to 30 or 40 percent.
Want more information on safety stock? You can read more about safety stock here.
Report columns
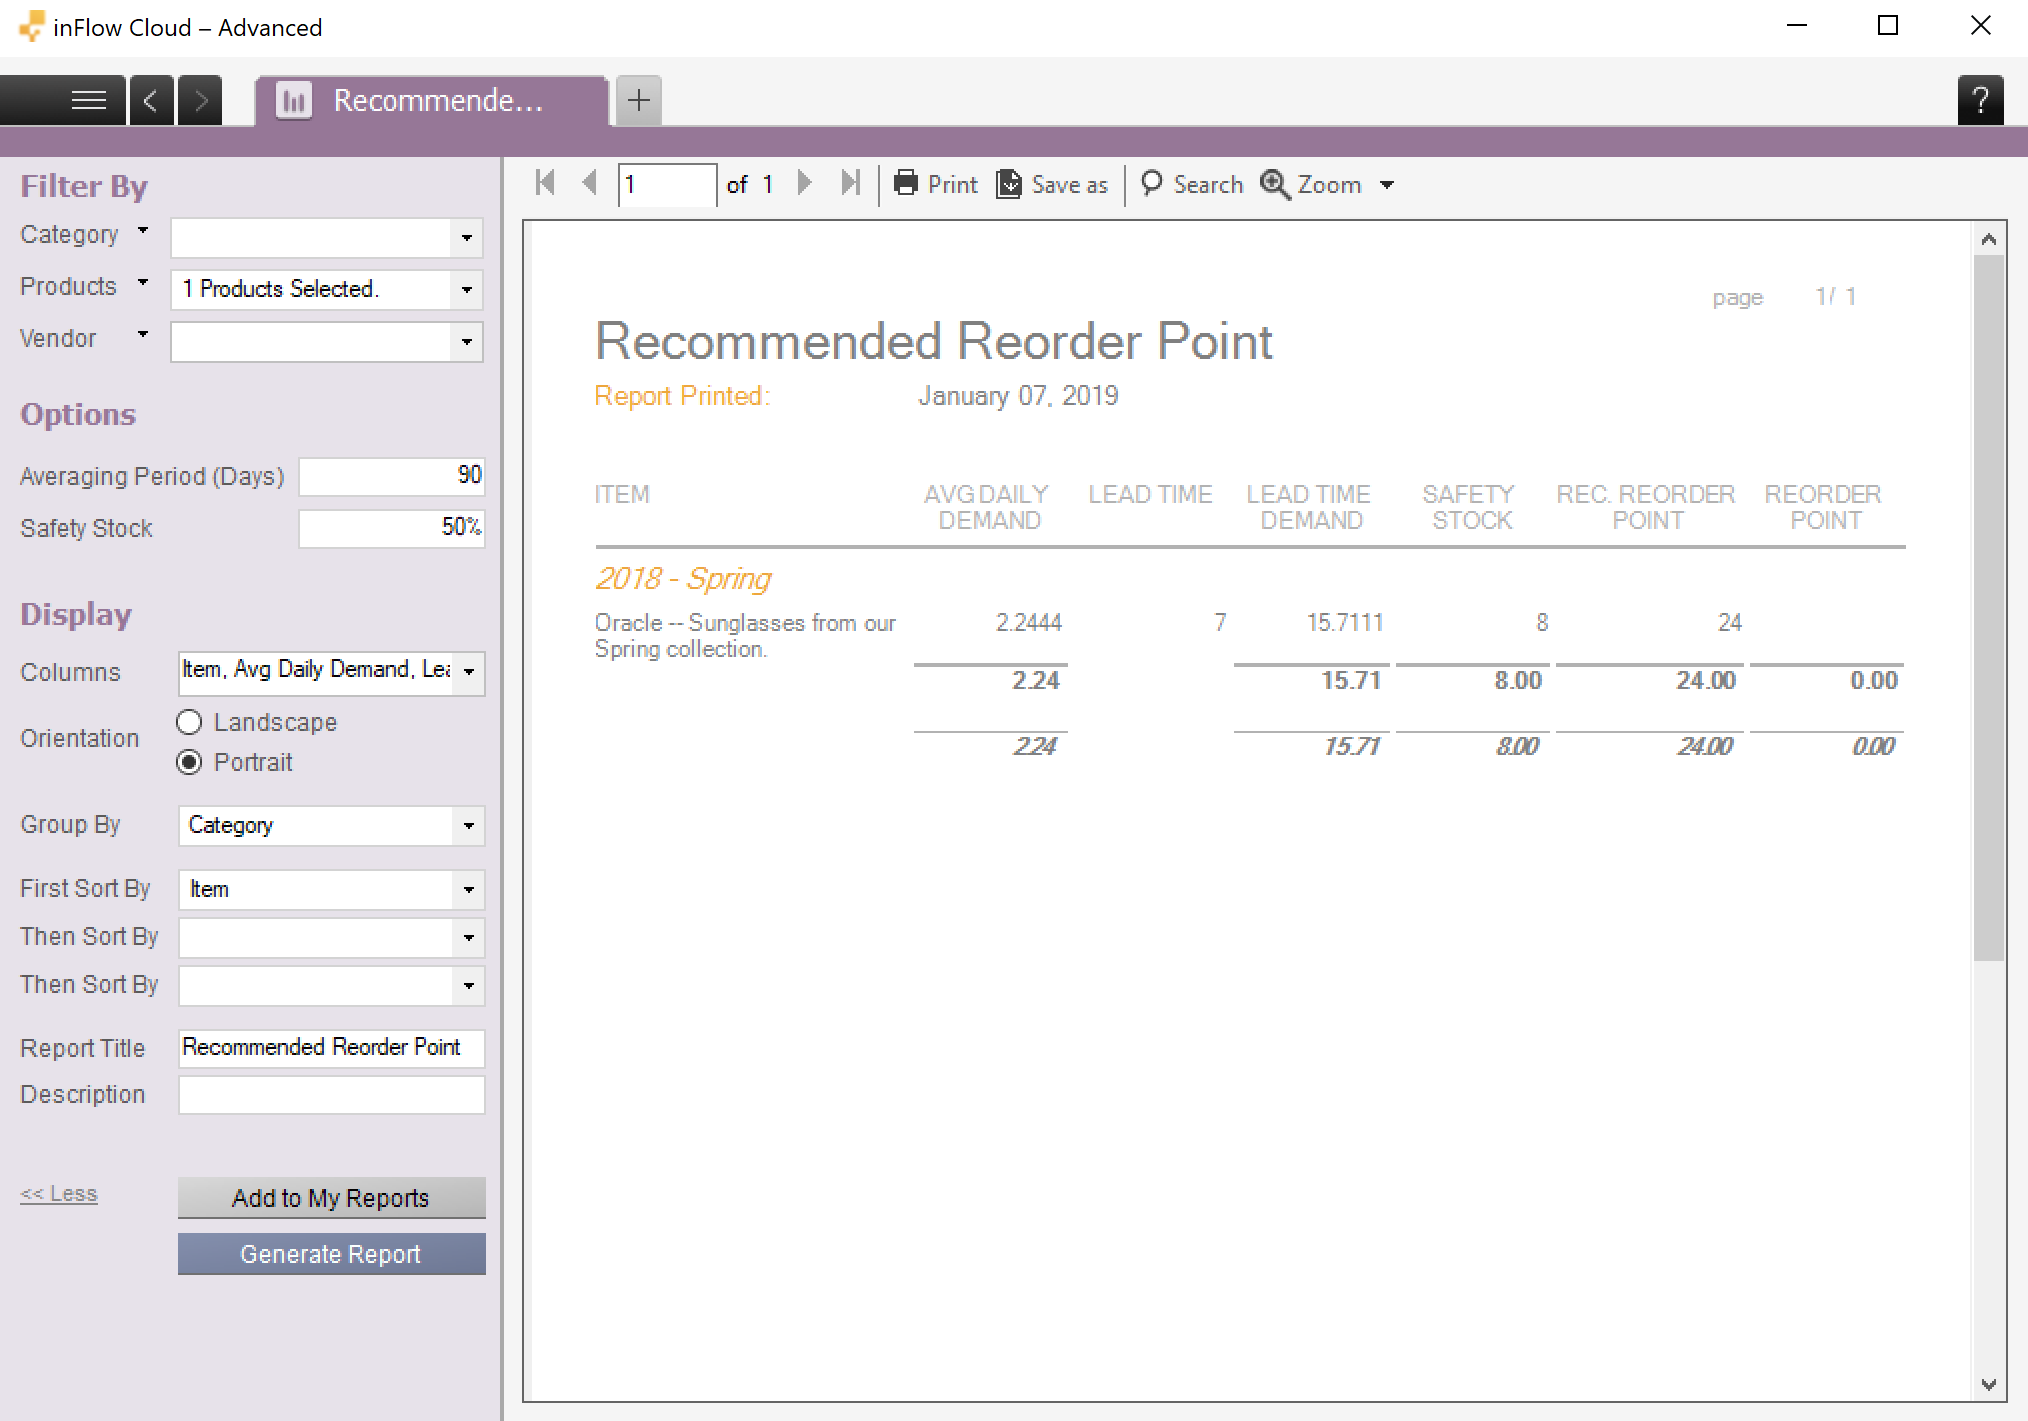
In the above example we’ve selected a single product and we’ve set the Averaging Period (Days) to 90, and Safety Stock to 50%.
Click Generate Report. You’ll see a list of columns and numbers.
The Avg daily demand is the amount sold (or used in a work order) over your chosen period of days. With the example here of 2.2444, it means that over the last 90 days, we’ve sold (or used) about 200 units.
Lead time is your vendor’s lead time as mentioned above. If you have multiple vendors for this item, it will show the lead time for the last vendor you purchased from.
Lead time demand is the amount sold or used before your next purchase order comes in. This is basically average daily demand multiplied by lead time.
Safety Stock, as mentioned above, is the extra amount in stock to reduce the risk of it running out. We’ve set it to 50% of the demand. As our demand is calculated to be about 15.7 units, 50% of that is about 8 units (rounded up).
Finally, we arrive at recommended reorder point. This is simply your lead-time demand plus safety stock. In this example, that’s 15.7 plus 8, to give a recommended reorder point of 24 units (rounded up).
The final column is your current reorder point (which we have not set in our example). It’s listed there so you can compare the recommended reorder point against the current reorder point.
Step 3: Adjust your reorder point
Now that you’ve got the numbers, here are some things to keep in mind:
This report only estimates how quickly your product sells based on historical demand. We encourage you to use your judgment to adjust your reorder point for each product.
For example, you should increase the reorder point above inFlow’s recommendation if you are forecasting increased sales (promotions, seasonal demand), or decrease the reorder point if you are forecasting a drop in sales (end of promotion, newer model was released).
If you’re seeing a blank or low recommended reorder point, it’s likely due to inFlow not having enough sales history for that item. If you’ve added a new product to the database and it’s only been selling for the past week, it’s unlikely that there would be enough information to calculate the average daily demand of the past 90 days.


0 Comments