



Key takeaways
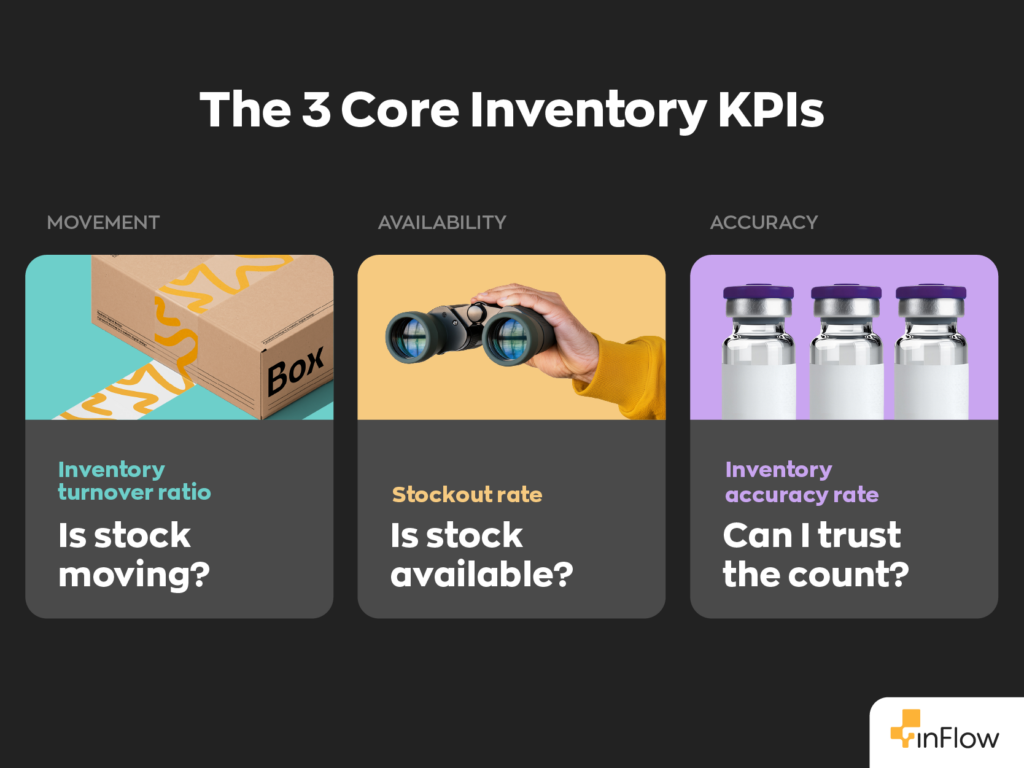
- Small businesses should start by tracking three inventory KPIs: inventory turnover ratio, stockout rate, and inventory accuracy rate.
- The full set of 12 KPIs expands into cost, profitability, and fulfillment metrics, including DSI, carrying costs, GMROI, and more.
- KPI benchmarks should be treated as reference points rather than fixed targets because performance varies by industry and business size.
- Accurate inventory records are essential because unreliable counts undermine every other inventory KPI. Regular cycle counting can help businesses maintain the typical 95–99% inventory accuracy target.
- Inventory software can automatically calculate and update KPIs in real time, reducing manual spreadsheet work and giving small teams a simpler way to monitor inventory health.
Small businesses should track three inventory KPIs first: inventory turnover ratio, stockout rate, and inventory accuracy rate. Together they show whether stock is selling, available, and accurate.
The other nine metrics below add detail once those three are in place. Each KPI includes its formula and a target benchmark.
Benchmark ranges vary by industry and business size. Treat them as reference points rather than fixed targets, and weigh your own trend over time more heavily than any single industry average.
Where to start: the small-business starter set
If you track nothing else, track inventory turnover, stockout rate, and inventory accuracy rate. Turnover shows whether stock is moving, stockout rate shows whether it is available when customers want it, and accuracy shows whether your records can be trusted. Most small teams can run daily operations on those three and add the rest as the business grows.
This is the inFlow starter set: get movement, availability, and accuracy under control first, then add cost and fulfillment metrics once the first three are stable.
The 12 inventory KPIs at a glance
The table below lists each KPI, its formula, and a typical target range. Full definitions follow.
| # | KPI | Formula | Typical benchmark |
| 1 | Inventory Turnover Ratio | COGS / Average Inventory | 4–6 for general retail; higher for perishables |
| 2 | Days Sales of Inventory (DSI) | (Average Inventory / COGS) × 365 | Lower is better; varies by category |
| 3 | Carrying Cost of Inventory | Total Carrying Costs / Average Inventory Value × 100 | 20–30% of inventory value per year |
| 4 | Stockout Rate | (Number of Stockouts / Total Sales Opportunities) × 100 | Below 2% |
| 5 | Inventory Accuracy Rate | (Counted Items Matching Records / Total Items Counted) × 100 | 95–99% |
| 6 | GMROI | Gross Profit / Average Inventory Cost | 1.0 is break-even; 2.0–3.0+ for healthy retail |
| 7 | Sell-Through Rate | (Units Sold / Units Received) × 100 | 70–80% per month (varies seasonally) |
| 8 | Backorder Rate | (Backordered Orders / Total Orders) × 100 | Close to 0% |
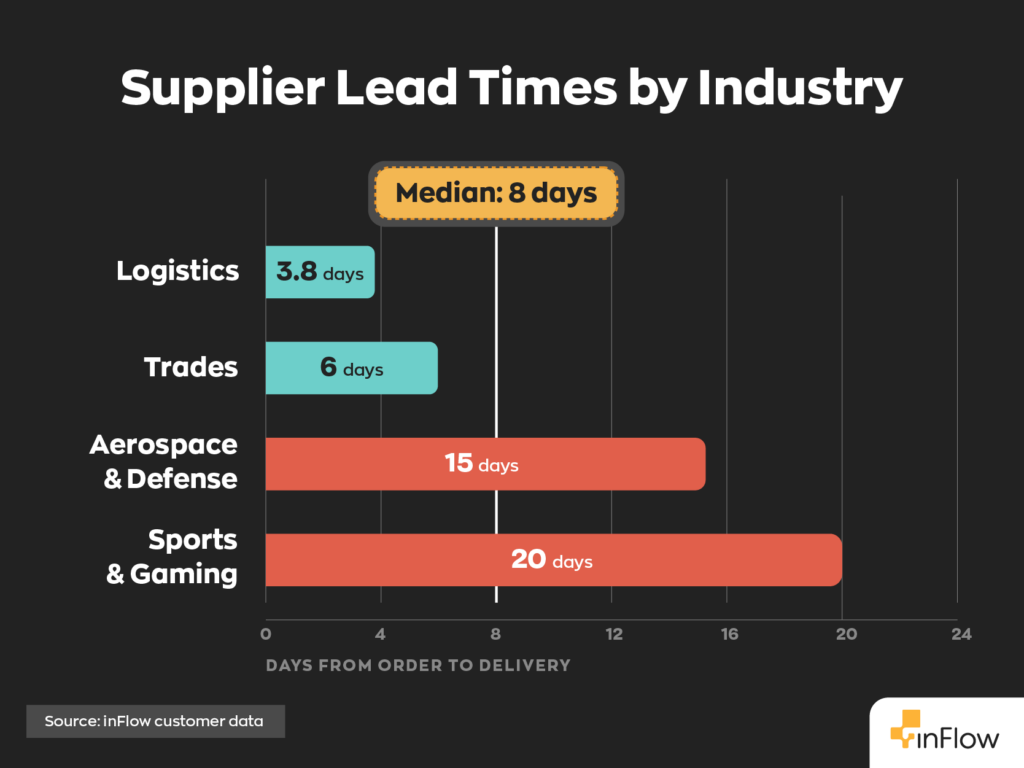
| 9 | Lead Time | Order Delivery Date − Order Placement Date | Median 8 days across inFlow customers; varies widely by industry |
| 10 | Order Cycle Time | Sum of (Delivery Date − Date Order Placed) / Total Orders Shipped | 3–7 days typical; 2–5 days for ecommerce |
| 11 | Rate of Returns | (Units Returned / Units Sold) × 100 | 16% average across US retail; 19% for ecommerce; higher still for apparel |
| 12 | Dead Stock Percentage | (Value of Stock Unsold 12+ Months / Total Inventory Value) × 100 | Below 5% of inventory value |
Benchmarks are general industry reference ranges except rows 9 and 10, which draw on inFlow customer data. The carrying-cost range is a general industry rule of thumb. The turnover and returns ranges vary most by industry.
Several formulas below use average inventory: add your inventory value at the start of the period to its value at the end, then divide by two. Using a current snapshot instead will skew turnover, DSI, carrying cost, and GMROI.
1. Inventory turnover ratio
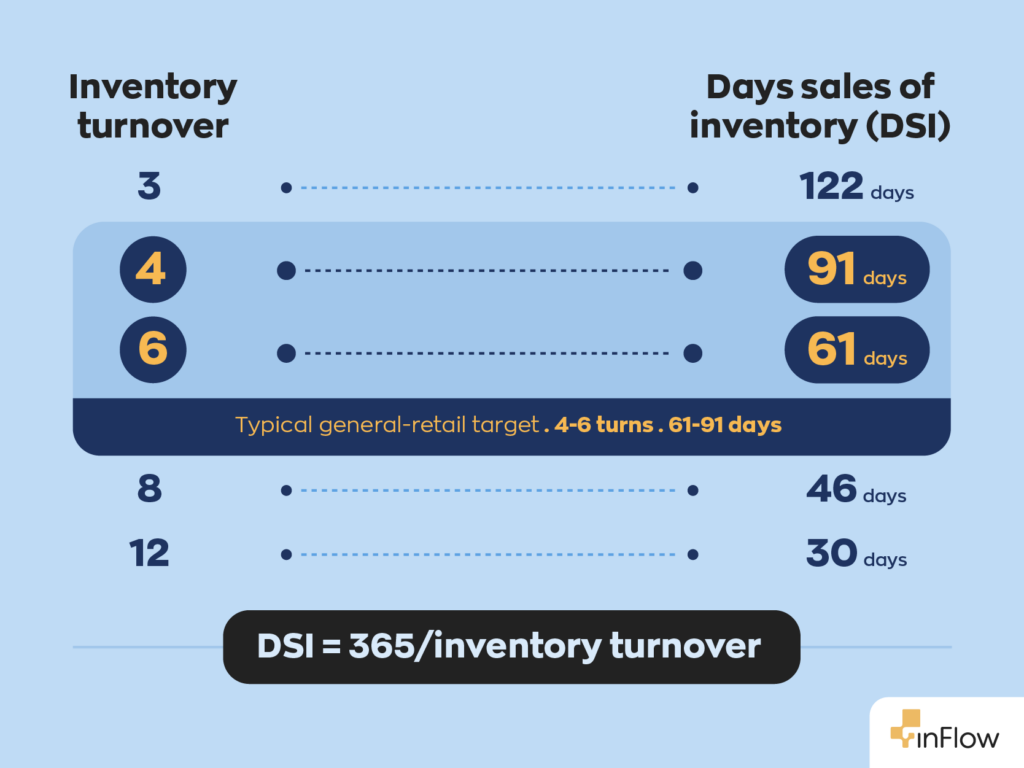
Inventory turnover ratio measures how many times a business sells and replaces its inventory during a set period. General retail businesses often target a ratio between 4 and 6, while businesses selling perishable goods aim higher.
A low ratio can signal overstocking or weak demand. A very high ratio often indicates that stock is selling well, though it can also point to chronic understocking and missed sales.
Formula: Cost of Goods Sold (COGS) / Average Inventory
2. Days sales of inventory (DSI)
Days sales of inventory measures how many days products sit in storage before selling. Lower DSI usually means healthier cash flow and less money tied up in unsold stock.
High DSI can suggest slow-moving products or purchasing decisions that run ahead of demand. DSI is the inverse view of turnover, expressed in days rather than cycles: a turnover ratio of 6 works out to roughly 60 days of inventory on hand. For a macro reference point, the Census Bureau’s inventories-to-sales ratio tracks roughly how many months of stock US businesses hold.
Reducing the cost of each unit sold improves margin, but note that lowering total COGS with inventory held flat actually lowers turnover and raises DSI. One solar installer cut its COGS from 40% to 32% after switching to inFlow.
Formula: (Average Inventory / COGS) × 365
3. Carrying cost of inventory
Carrying cost measures the total expense of holding inventory over time. It includes storage, insurance, capital cost (the money tied up in stock that could be earning elsewhere), and risk costs such as obsolescence and shrinkage. Most businesses spend 20% to 30% of average inventory value per year on carrying costs, a widely cited industry rule of thumb.
Tracking this figure shows the real cost of holding stock that is not selling, which a turnover ratio alone does not reveal.
Formula: (Storage + Insurance + Capital + Risk Costs) / Average Inventory Value × 100
4. Stockout rate
Stockout rate tracks how often products are unavailable when customers try to order them. Most inventory benchmarks recommend staying below 2%.
A high stockout rate usually points to weak forecasting or reorder points that trigger too late. It directly costs sales, so it belongs in the small-business starter set.
Formula: (Number of Stockouts / Total Sales Opportunities) × 100
5. Inventory accuracy rate
Inventory accuracy rate compares physical stock counts against system records. Most businesses target 95% to 99%.
Regular cycle counts keep this number high and reduce purchasing mistakes and fulfillment errors. A cycle count means counting a small subset of items on a rotating schedule rather than shutting down to count the whole warehouse at once. Low accuracy undermines the other KPIs, since the inputs themselves become unreliable.
Formula: (Counted Items Matching Records / Total Items Counted) × 100
6. Gross margin return on investment (GMROI)
GMROI measures how much gross profit inventory generates relative to its average cost. A GMROI of 1.0 is break-even; healthy retail businesses typically run 2.0 to 3.0 or higher.
A ratio below 1.0 means the inventory is returning less than it costs to hold, which can signal weak pricing or too much money tied up in stock. GMROI connects inventory decisions directly to profitability.
Formula: Gross Profit / Average Inventory Cost
7. Sell-through rate
Sell-through rate measures how much received inventory sells within a set period. Many businesses target monthly rates between 70% and 80%, though seasonal categories swing more widely.
Strong sell-through usually reflects healthy demand and balanced purchasing. Weak sell-through is an early signal that stock may become dead stock.
Formula: (Units Sold / Units Received) × 100
8. Backorder rate
Backorder rate tracks how many customer orders are delayed because inventory is unavailable. Most businesses aim to keep it close to 0%.
A rising backorder rate often reveals supplier delays, stock shortages, or demand planning that is not keeping pace. The difference from stockout rate is timing: a stockout means the customer couldn’t order the item, while a backorder means they ordered it but the shipment is delayed.
Formula: (Backordered Orders / Total Orders) × 100
9. Lead time
Lead time measures the number of days between placing an order with a supplier and receiving it. Your lead times vary widely by supplier and industry, so the trend over time tells you more than any single figure.
Accurate lead-time tracking lets you set reorder points that account for how long replenishment actually takes, which reduces stockouts.
Based on inFlow customer data, the median supplier lead time is 8 days, though it varies sharply by industry. Fast-moving sectors replenish in under a week (Logistics at 3.8 days, Trades at 6 days), while sectors with complex procurement run much longer (Aerospace & Defense at 15 days, Sports & Gaming at 20 days). The data also shows a link between operational maturity and sourcing speed: in the Industrial sector, businesses on mid-tier plans reported median lead times 42% shorter than those on entry-level plans.
Formula: Order Delivery Date − Order Placement Date
10. Order cycle time
Order cycle time measures how long customers wait to receive a purchase after ordering. Many ecommerce sellers target delivery windows of two to five days.
Slow cycle times hurt customer satisfaction and increase support requests. Unlike lead time, which looks upstream at suppliers, order cycle time looks downstream at customers. Based on inFlow customer data, the median order cycle time ranges from 3 days (Food & Beverage, Lifestyle & Hobbies) to 11.5 days (Airlines & Aviation), with most industries clustering in the 3–7 day window.
Formula: Sum of (Delivery Date − Date Order Placed) / Total Orders Shipped
11. Rate of returns
Rate of returns measures how many sold products customers send back. Return rates average about 16% across US retail and about 19% for ecommerce, according to the NRF’s 2025 Retail Returns Landscape report, with apparel routinely higher.
A high return rate can reveal product quality issues or inaccurate product listings. Tracking returns by product also flags listings that set the wrong expectations.
Formula: (Units Returned / Units Sold) × 100
12. Dead stock percentage
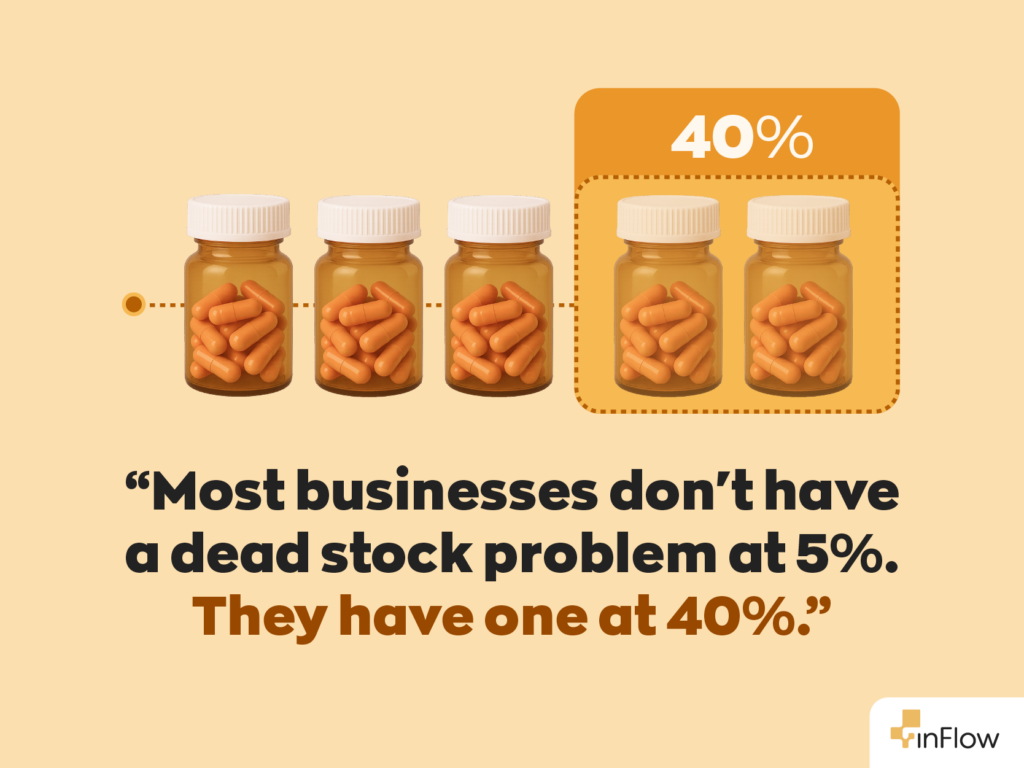
Dead stock percentage measures the value of products that have gone unsold for more than 12 months. Most businesses aim to keep dead stock below 5% of total inventory value.
Dead stock ties up cash and storage space without returning value. Tracking it makes the cost of slow movers visible so you can discount or liquidate them before they accumulate.
The 5% target is aspirational, and real inventories usually carry far more dormant stock than that. Based on inFlow customer data, the median share of stocked SKUs with no sales in the past 12 months ranges from 40% in Food & Beverage to 91% in Aerospace & Defense. Most businesses carry a long tail of slow movers alongside a smaller group of high-demand products, and larger businesses tend to manage that tail more aggressively: in Fashion & Accessories, companies on higher-tier plans carry 22 percentage points fewer dormant SKUs than those on entry-level plans. Note that this measures the share of SKUs without recent sales, which runs higher than dead stock as a percentage of inventory value.
Formula: (Value of Unsold Stock in 12+ Months / Total Inventory Value) × 100
How to track these KPIs without manual math
Inventory software calculates these KPIs automatically and updates them in real time, which removes the counting errors and reporting delays that come with manual spreadsheets. Many systems track stock movement, reorder levels, and sell-through without extra data entry.
For a small team, the starter-set metrics (turnover, stockout rate, and accuracy) can update on their own as orders and counts happen, rather than waiting for an end-of-month spreadsheet.
Build a one-page dashboard
Too many reports slow decisions down. Most small inventory teams only need a handful of KPIs to run daily operations well, and inventory turnover, stockout rate, and inventory accuracy rate are a strong starting point. Add cost and fulfillment metrics as the business grows.
Use historical data to set reorder points
Past sales data reveals patterns that are easy to miss day to day, including seasonal demand and recurring supplier delays. Reorder points that adjust to past sales and lead times prevent both overstocking in slow periods and shortages in busy ones, and they help dampen the bullwhip effect that amplifies small demand swings into large inventory swings upstream.
Track these KPIs in real time
Strong inventory KPIs help small businesses control costs, improve cash flow, and make better purchasing decisions. Start with turnover, stockout rate, and accuracy, then expand as you grow.
inFlow Inventory’s reporting suite calculates these KPIs for you and updates them in real time, so you can monitor stock health without the manual math. Explore inFlow’s reporting features.
FAQ
Which inventory KPIs should a small business track first?
Start with inventory turnover ratio, stockout rate, and inventory accuracy rate, which show whether stock is selling, available, and counted correctly. Those three are enough to run daily operations for most small teams.
What is a good inventory turnover ratio?
General retail businesses often target 4 to 6. Businesses selling perishable goods aim higher, since slow turnover risks spoilage.
What is a healthy inventory accuracy rate?
Most businesses target 95% to 99%. Regular cycle counts are the most reliable way to keep accuracy in that range.
0 Comments