

Key takeaways
- DSI measures how many days it takes a business to sell its inventory on average.
- The DSI formula is: (Average inventory / Cost of goods sold) x 365.
- Average inventory is usually calculated by adding beginning and ending inventory values, then dividing by two.
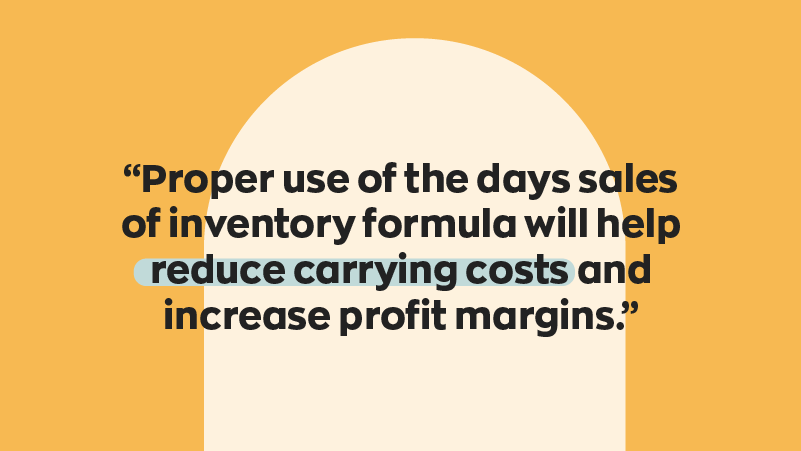
- A high DSI can mean a business is holding too much stock, which increases carrying costs and reduces profit margins.
- A low DSI usually means inventory sells quickly, but businesses need strong processes to avoid stockouts.
- DSI should be compared within your industry and considered alongside seasonality, demand, and other inventory metrics.
Knowing how quickly stock sells gives businesses a good insight into their inventory management. No matter the size of your business or the industry you’re in, it’s important to know how long you hold onto stock so you can optimize processes. This is where the days sales of inventory formula comes in.
We know it can be a pain to keep all of these formulas straight. So we decided to create a handy Inventory Formula Cheat Sheet with 7 of the most common inventory formulas.
Download your inventory cheat sheet now!
But for today, we’re getting into more detail on the days sales of inventory formula, what it is, and when it comes in handy.
What exactly is days sales of inventory (DSI)?
In short, DSI is the number of days it takes to sell stock. We usually use the days sales of inventory formula to calculate the average number of days based on yearly stats, although this depends on the figures you decide to use (more on this below).
Days sales of inventory is sometimes called average age of inventory.
Why does DSI matter?
If you know how many sales you make per year, you might wonder why it matters how long each piece of inventory takes to sell. Let’s look at an example.
Imagine a local appliance store is hitting its sales targets. The owner, Sam, gets special rates when she orders several items at once from the manufacturer, which means better margins and sales figures look good. Great news, right?
One problem is that holding stock costs money, known as carrying costs. Because the owner keeps ordering in bulk, it takes the business longer to sell through its inventory. Each fridge, dishwasher, and other appliance takes up room, requires insurance, and risks damage. The longer an item takes to sell, the more it will cost to carry, eating into gross profit.
So, you could have great sales figures but still, hold too much stock. This is where calculations such as days sales of inventory come in. Properly using DSI will allow you to make more informed decisions when ordering new inventory. This means you won’t be left holding excess inventory, which will ultimately eat into your profit margin.
We’ll look at this example again later on using the formula below.
How do you calculate days sales of inventory?
The days sales of inventory formula looks something like this:
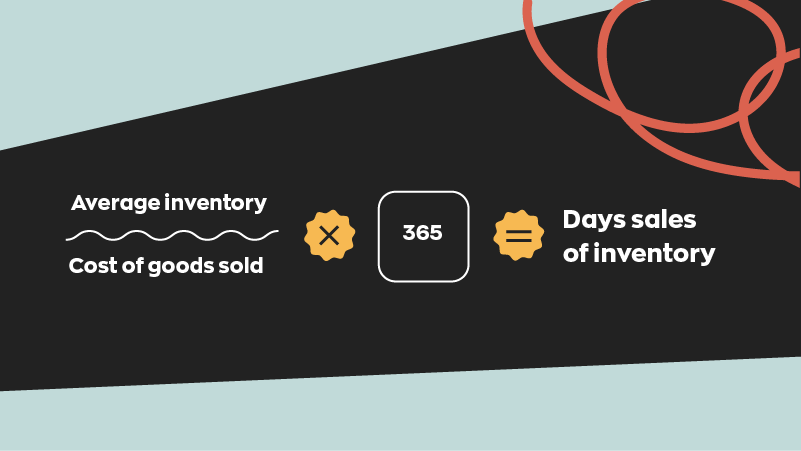
You might come across slight variations, but usually, these are different ways of arriving at the same answer. Let’s look at each part of the formula in more detail below.
Average inventory
This is the mean average of inventory available in a given time period. Usually, it is calculated to find the value rather than the number of units. You can calculate your average inventory by adding your starting and ending inventory values of a given period and dividing that number by 2. So for example say you started with $200,000 in a given period and ended with $150,000. You would take $200,000 add $150,000 and divide by 2 giving you $175,000. Some formulas use ending inventory instead of average inventory. If you decide to use that method, remember that your ending inventory might not be representative of other points of the year, especially if you experience seasonal fluctuations. To get an even more accurate average inventory you could also take more data points throughout the given time period and simply divide by the number of data points you choose.
Cost of goods sold (COGS)
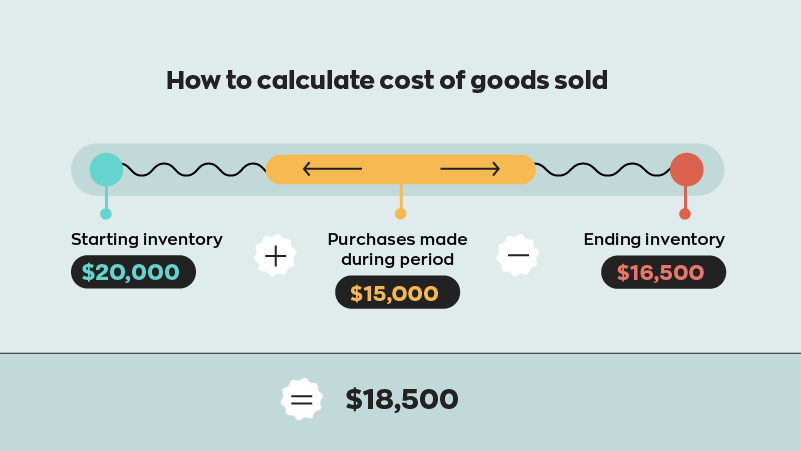
Simply put, COGS is how much the inventory sold cost your business (not the customer). The basic COGS formula is:
It’s generally a good idea to stay on top of your cost of goods sold so you know exactly how much your sales cost you. If you’re not sure what to include, we’ve created a useful quick guide to COGS to help.
Example using the days sales of inventory formula
Let’s go back to our example of Sam’s appliance store. Sam’s average inventory value is $13,000 and her cost of goods sold is $140,000. To find her days sales of inventory, the formula looks like this:
(13,000 / 140,000) x 365 = 33.89
So, it takes Sam around 34 days to sell her inventory.
DSI and inventory turnover
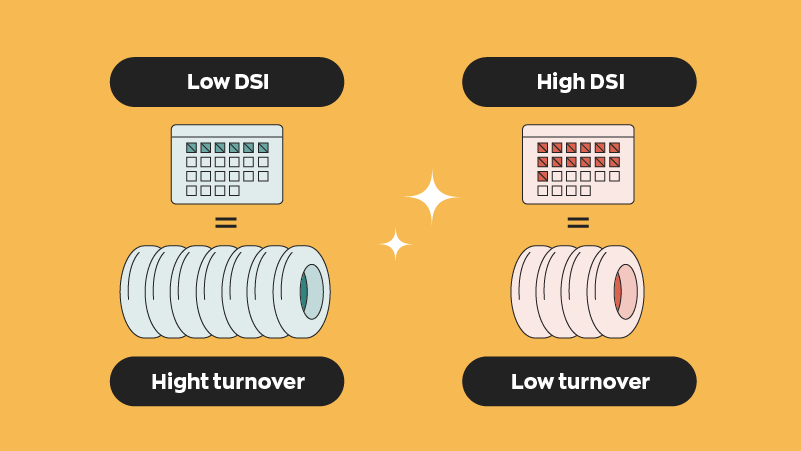
Days sales of inventory is closely linked to inventory turnover. If DSI tells you how many days it takes to sell stock, inventory turnover tells us how many times you sell through stock.
So, a low days sales of inventory ratio means a high turnover (because you can sell more times in a given period if each sale takes fewer days).
What do DSI and turnover ratios mean?
Low turnover and high days sales of inventory figures usually indicate something needs to change. If you have a low turnover ratio, you might be holding excess inventory. This comes with carrying costs.
Carrying costs can be 20%-30% of your inventory value. This is an issue for both manufacturers and retailers alike. Carrying costs come from a variety of factors, including the cost of the space the inventory takes up, handling costs, loss of value, and more.
On the other hand, if you have a high turnover ratio and low days of sales, you probably sell stock quickly. This means that it’s especially important to have good inventory management processes in place to keep up with demand. Your customers will expect prompt service without stockouts, no matter how busy the business is.
This might mean organizing your warehouse, implementing barcoding, or more.
Comparing your days sales of inventory ratio
It might be tempting to compare your days sales of inventory figures to other businesses. While this can give you an indication of how efficiently your business is operating, it’s important to remember that different industries will have different benchmarks.
For instance, a designer sofa may take longer to sell than a book, but the profit margins will be higher, which could compensate for the carrying costs involved in storing the item.
It’s also important to consider seasonal fluctuations and product demand, and to use DSI figures alongside other calculations when doing important business analysis.
0 Comments