 Fellow Canadians: All inFlow plans are available in Canadian dollars



Key takeaways
- Inventory metrics give businesses a way to benchmark their performance against other operators and identify areas that may need improvement.
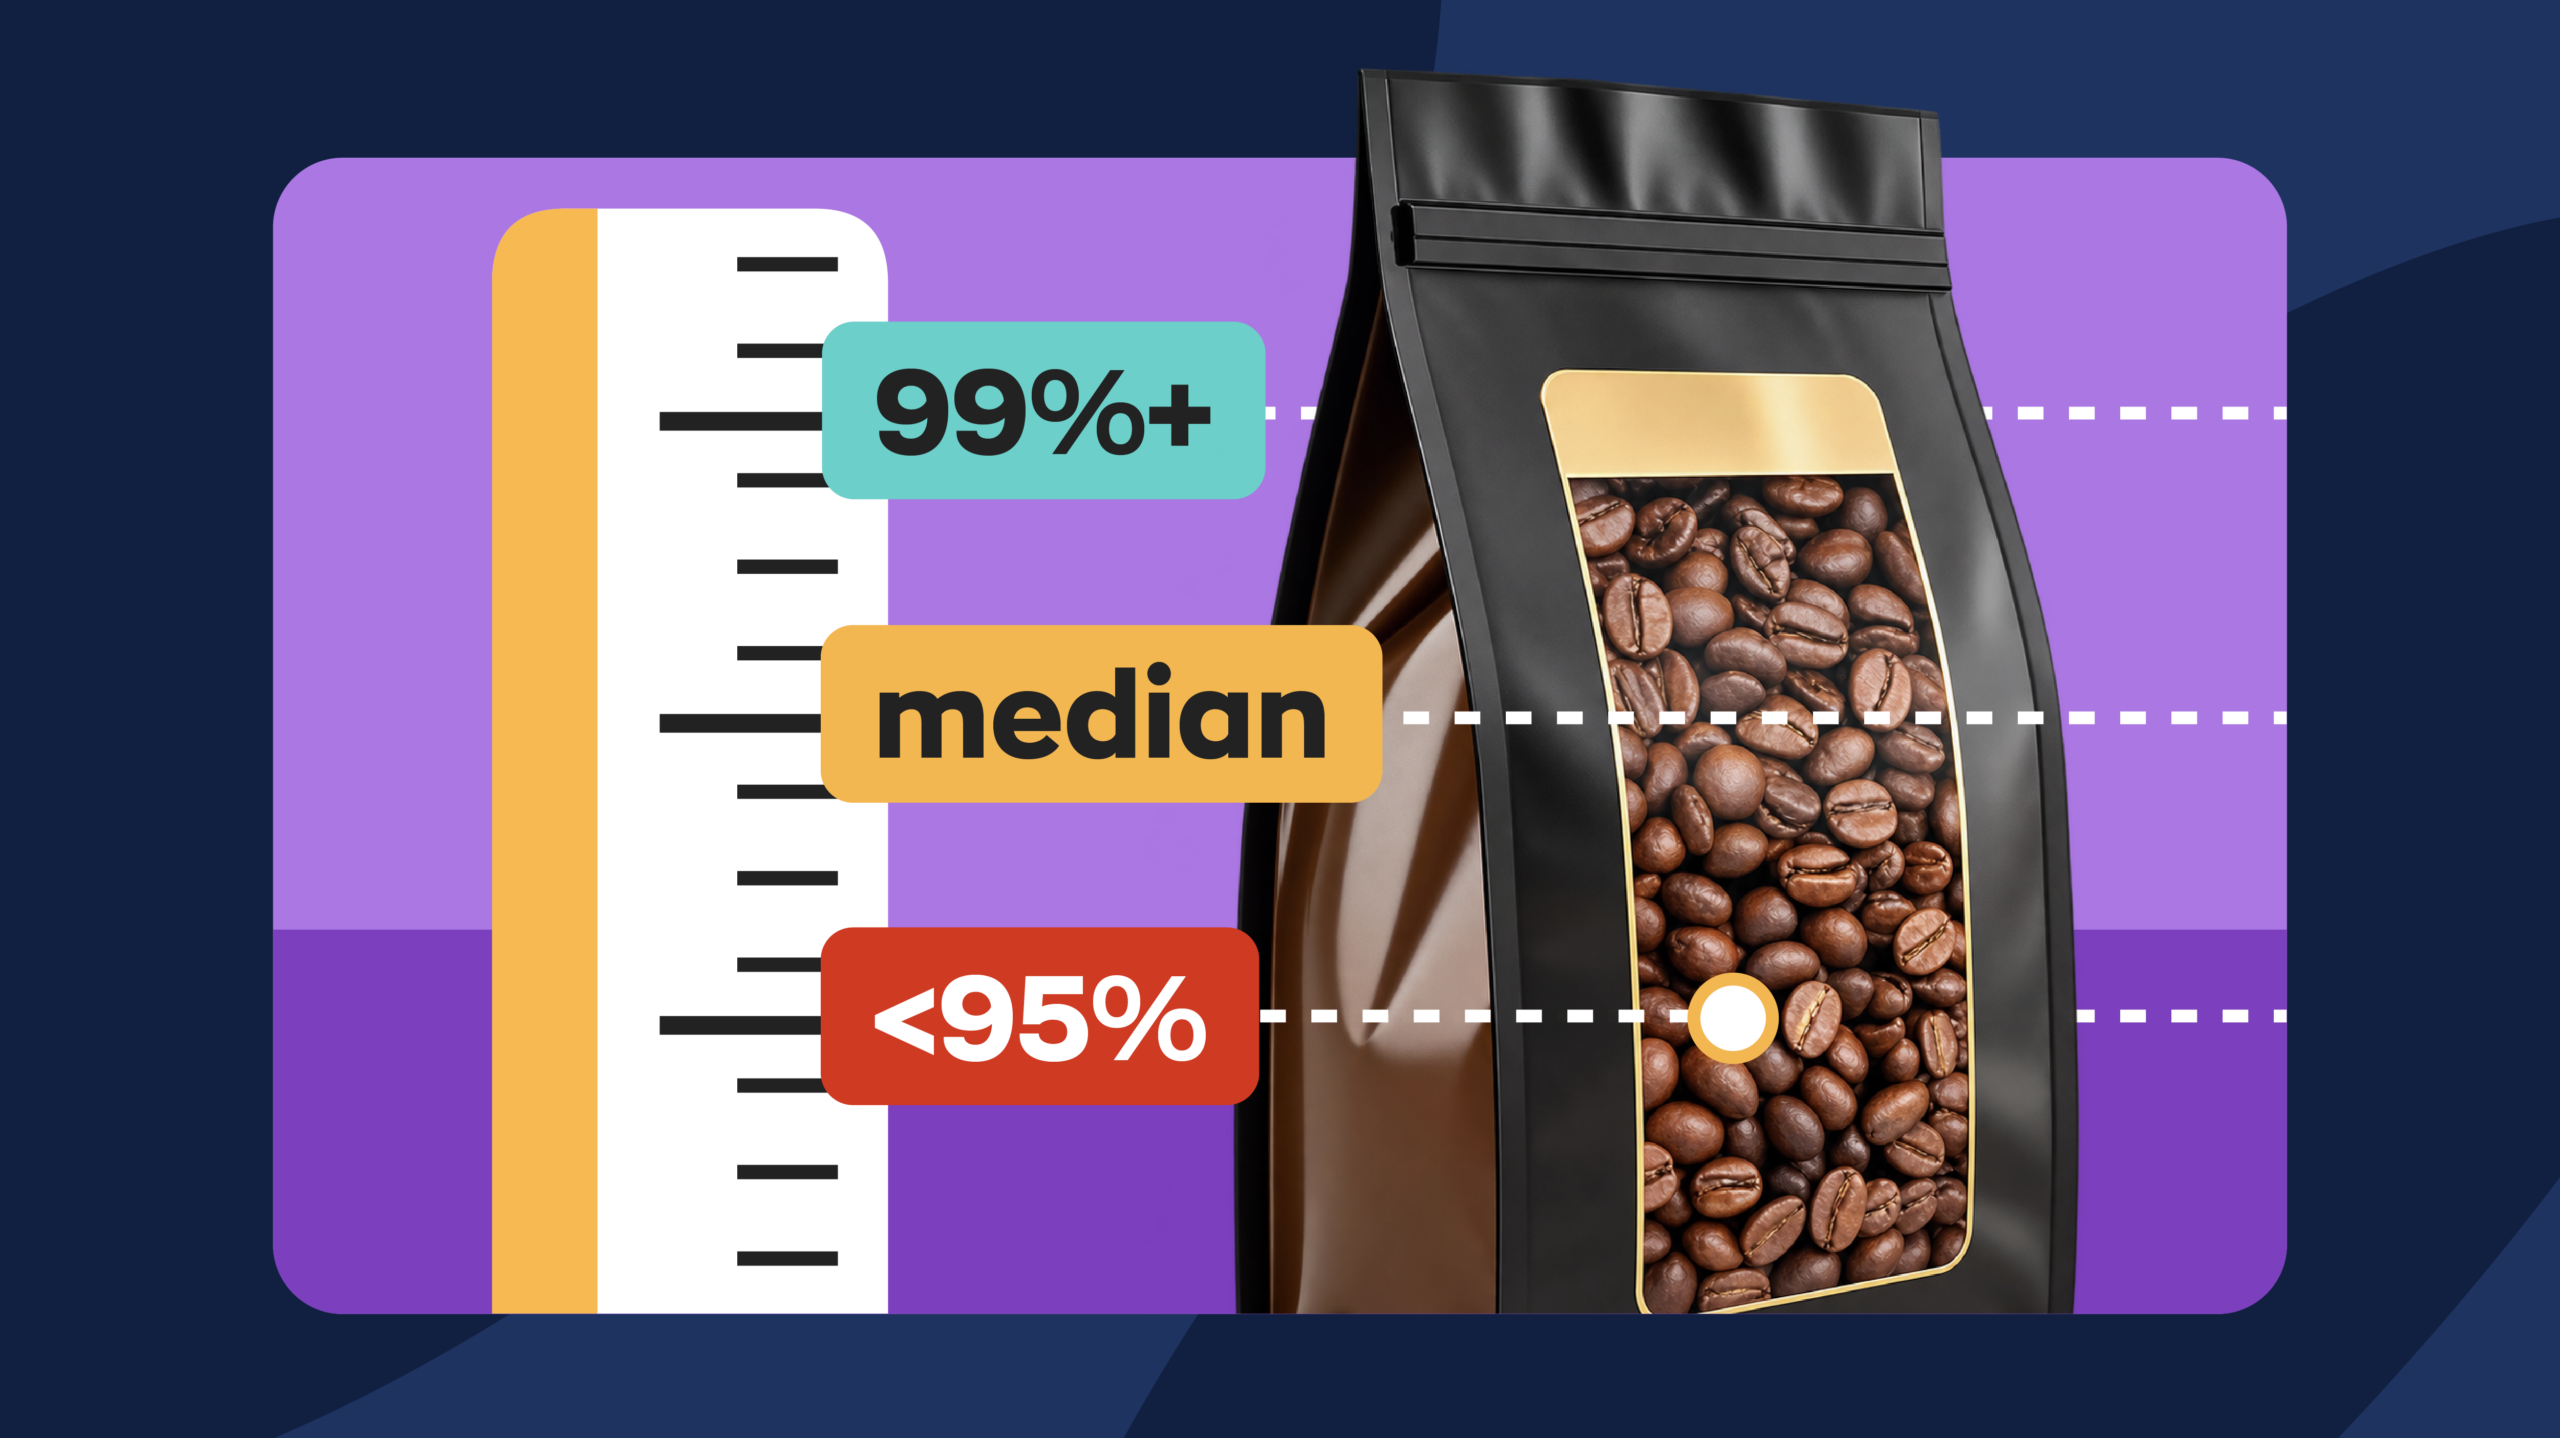
- Order accuracy typically falls between 95% and 98%, while only 16.2% of operators achieve 99% or higher.
- The median operator turns inventory 3–5 times per year, although turnover varies significantly by industry.
- Inventory shrinkage is widespread: 50.2% of operators lose 3% or more of their inventory annually, and 80% report shrinkage between 1% and 5%.
- Stockouts remain common, with 44% of operators experiencing them at least once a month.
- Most operators (55.8%) fulfill orders within two days, while only 13.8% achieve same-day fulfillment.
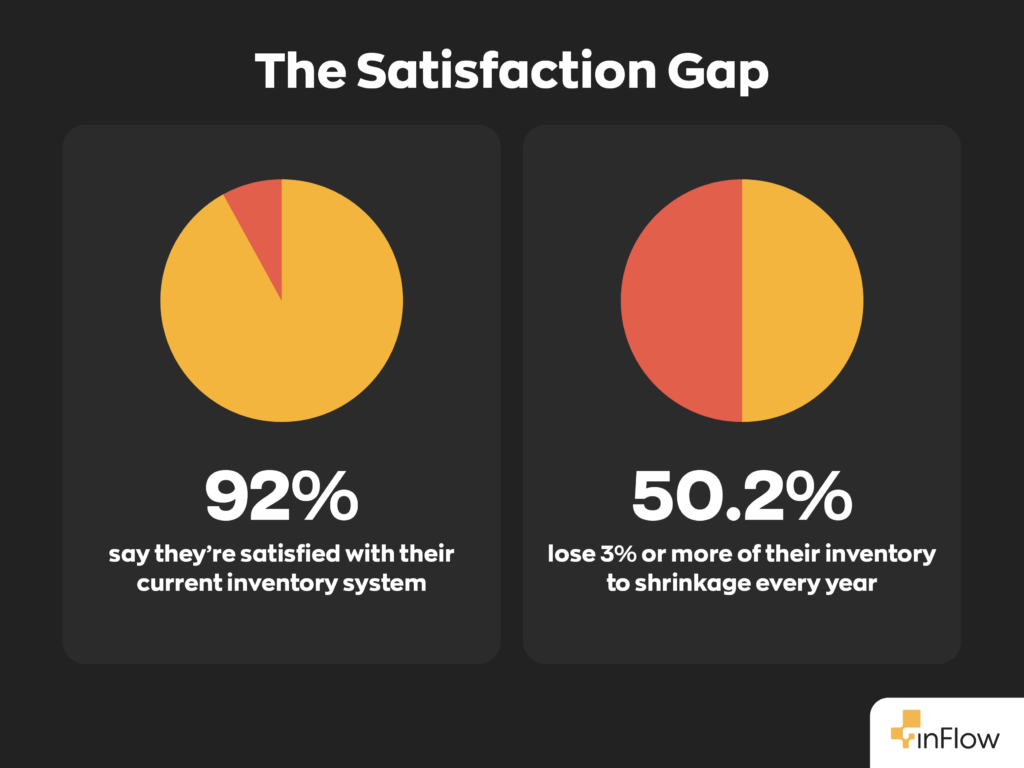
Ninety-two percent of the 400 inventory and warehouse operators we surveyed say they’re satisfied with their current system. Yet half of them lose 3% or more of their inventory to shrinkage every year.
Those two numbers shouldn’t sit this comfortably next to each other, and that’s exactly the point. Satisfaction and performance measure two different things, and without something outside your own four walls to compare against, there’s no reliable way to tell which one you’re actually looking at.
This article aims to provide you with a bit more perspective. We pulled five inventory metrics from a survey of 400 real operators and mapped out where the middle actually sits, so you can see whether your numbers are ahead of the pack, right in the middle, or lagging.
How to read these numbers
This data comes from inFlow’s State of Inventory Management 2026 survey: 400 SMB inventory and warehouse operators, fielded in March 2026, self-reported in bands. One honest caveat: self-reported figures tend to skew a bit optimistic, so treat these benchmarks as a reasonably generous read on where the industry actually stands.
1. Order accuracy
| Order Accuracy Rate | Share |
| 99–100% | 16.2% |
| 95–98% | 54.5% |
| 90–94% | 23.8% |
| Under 90% | 4.8% |
| Not sure | 0.8% |
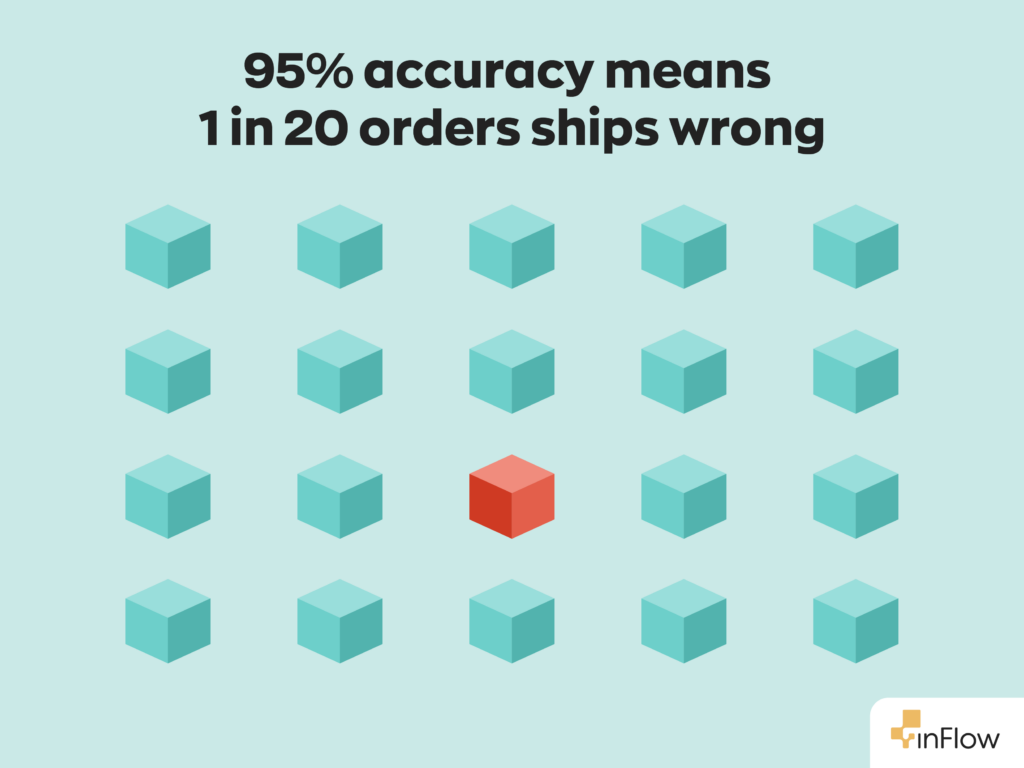
When it comes to order accuracy, the median operator sits in the 95–98% band. Only one in six reaches 99% or higher, and 28.5% fall below 95%. In practice, that means at 95% accuracy, 1 in 20 goes out wrong. The gap between the median band and the top band looks small on a chart and considerably larger once you’re the one processing the return.
2. Inventory turnover
| Annual Inventory Turns | Share |
| More than 7 | 10.8% |
| 5–7 | 21.8% |
| 3–5 | 35.2% |
| 1–3 | 27.0% |
| Less than 1 | 3.8% |
| Not sure | 1.5% |
The median band for inventory turns per year is 3–5 turns a year, and 30.8% of operators turn under 3x. One caveat worth repeating: inventory turnover is heavily industry-dependent. A food distributor and a construction supplier shouldn’t read this row the same way, so compare within your vertical rather than against the aggregate.
If you want a vertical-level reference point, the U.S. Census Bureau publishes monthly inventories-to-sales ratios broken out by kind of business.
3. Inventory shrinkage
| Annual Inventory Shrinkage | Share |
| Less than 1% | 9.5% |
| 1–3% | 39.0% |
| 3–5% | 41.0% |
| More than 5% | 9.2% |
| Not sure | 1.2% |
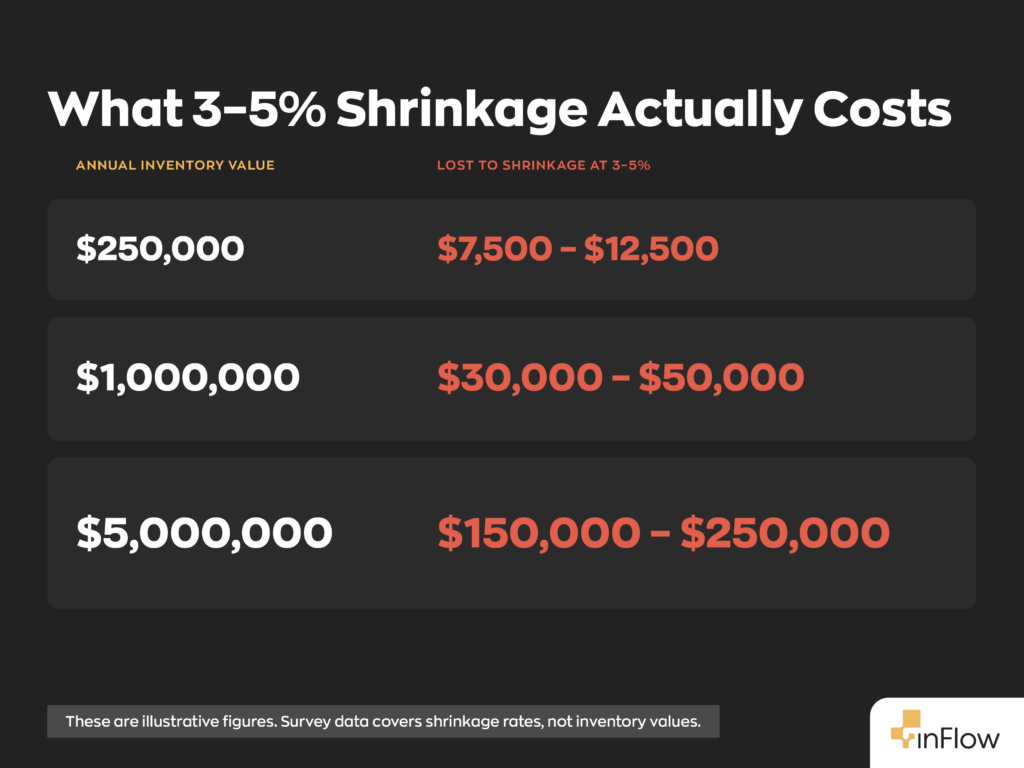
Inventory shrinkage shows the sharpest number in the whole survey: 50.2% of operators lose 3% or more of their inventory a year. The largest single band is 3–5%, not the low end most people assume when they picture “normal” shrinkage. Eighty percent of respondents fall somewhere between 1% and 5%, which makes this the metric where “normal” turns out to be more expensive than most operators expect.
For context, the most recent National Retail Federation’s National Retail Security Survey put the average retail shrink rate at 1.6% of sales. That’s less than half the 3–5% band where most of our respondents land. However, NRF surveys loss-prevention executives at large retail brands, a very different population from the SMB operators here.
4. Stockout frequency
| Stockout Frequency | Share |
| Rarely or never | 23.8% |
| Less than monthly | 31.8% |
| 1–3x per month | 29.5% |
| 1–2x per week | 10.8% |
| More than 2x per week | 3.8% |
| Not sure | 0.5% |
Forty-four percent of operators face a stockout at least once a month. But if you look at the spread you’ll notice that nearly a quarter rarely or never do. That makes this the most evenly spread of the five metrics. Some operators have genuinely solved for stockouts; most haven’t, and a large middle sits somewhere in between.
5. Order fulfillment time
| Order Fulfillment Time | Share |
| Less than 1 day | 13.8% |
| 1–2 days | 42.0% |
| 3–5 days | 38.5% |
| More than 5 days | 5.8% |
Just over half of operators (55.8%) have an order fulfillment time within two days. Only 13.8% do it same-day, which is worth flagging against the assumption that same-day fulfillment has become the norm. For B2B SMB operators, it clearly hasn’t. It’s also worth folding fill rate into this metric as the number behind the number: only 26.0% of operators hit a 96%+ fill rate, and 7.5% sit below 80%.
These five metrics aren’t independent
Shrinkage and stockouts correlate at r = +0.34 in this data. Both are downstream of the same underlying issue: knowing what you actually have, where it is, and how much of it is real. That’s why chasing them one at a time rarely works, and it’s likely why 49.5% of operators named inventory accuracy as an area needing improvement, the most-selected answer of the six, with 59.8% listing it among their top priorities for the next 12 months. It’s also why so many operators eventually turn to purpose-built tools like inFlow to close that visibility gap instead of trying to patch it with more manual counts.
Score yourself
Go back through the five sections above and, for each metric, ask honestly: are you in the top band, the median band, or below it?
Scored across all five metrics, 69.2% of operators aren’t in the bottom band on anything, and 25.2% are in the bottom band on exactly one. Set the bar at the median instead and the picture shifts: 51.8% fall below the median band on two or more metrics, and only 16.8% clear it on all five. That gap between “not failing” and “actually good” is where a fix produces the most ROI.
FAQ
What is a good order accuracy rate for inventory management?
Based on our 2026 survey data, the median operator runs at 95–98% order accuracy, and only about one in six reach 99% or higher. If you’re above 98%, you’re ahead of most of the market. If you’re below 95%, you’re in the bottom 28.5%, and it’s worth remembering that even 95% accuracy means 1 in 20 orders ship wrong.
What is a good inventory turnover ratio?
Most operators turn their inventory 3 to 5 times a year, which is the median band in our current survey data. That said, turnover is heavily dependent on industry: perishable or fast-moving goods businesses typically turn much faster, while durable goods and construction suppliers turn more slowly. Compare your ratio against businesses in your own vertical rather than the overall average.
How much inventory shrinkage is normal?
More than half of operators lose 3% or more of their inventory to shrinkage annually, and 80% fall somewhere between 1% and 5%. If your shrinkage is under 1%, you’re outperforming the vast majority of the market. If you’re above 5%, it’s worth investigating causes like theft, damage, or counting errors before it becomes a recurring cost.
What’s the difference between fill rate and order fulfillment time?
Order fulfillment time measures how long it takes to ship an order once it’s placed. Fill rate measures whether that order shipped complete, without backorders or partial shipments. The two metrics can diverge: an operation can ship quickly (good fulfillment time) while still shipping incomplete orders (poor fill rate), which is why it’s worth tracking both rather than just one.
What software should I use to track these inventory metrics?
Look for inventory software that gives you real-time visibility into stock levels, automates reorder points, and generates reports on accuracy, turnover, and shrinkage without manual counting. Barcode scanning in particular could be the single biggest lever for improving order and inventory accuracy, since it removes manual data entry from the picking and receiving process.
How can I improve my inventory accuracy?
The most common fixes are more frequent cycle counts, barcode scanning to remove manual entry errors, and tighter reconciliation between what your system says you have and what’s physically on the shelf. Since shrinkage and stockouts are correlated, improving the accuracy of your on-hand counts tends to reduce both problems at once rather than requiring separate fixes.
0 Comments