

Every year, analysts publish inventory benchmarks built from financial disclosures and industry aggregates. This report is different.
It comes directly from the people doing the work: warehouse managers, operations directors, owners, and supply chain leads who answered 38 questions about how they actually manage their inventory. No fluff, no projections. Just real data from the real boots on the ground.
We surveyed 400 professionals across 33 industries in March 2026, and what we found paints a fascinating, albeit sometimes contradictory, picture of where inventory management stands today.
Here are the five things that stood out most:
- Satisfaction is high, but it’s anchored to the status quo: 92% of operators say they’re satisfied with their current approach, yet inventory accuracy is their #1 area for improvement.
- Spreadsheets dominate at every company size. 85% of respondents use spreadsheets as a primary inventory tool, including 53% of companies with 500 or more employees.
- AI interest is at a historic high, yet adoption is near zero. 81% of operators want to implement AI. However, only 11% currently use AI tools.
- The cost environment is the most pressured it’s been in years. The cost of materials, freight, and labor costs are deadlocked as the top pressure sources, each cited by roughly 22–23% of respondents.
- These are veteran operators running mature businesses. 89% have four or more years of experience; they aren’t operational newbies.
These are just a few of the headline findings. Now let’s unpack the full data set and explore what it means for businesses today.
Who we surveyed
Before we get into the findings, it’s worth understanding who answered these questions, because context matters.
The people behind the data
The most common titles in our survey were Owner/Operator (26.2%), Operations Manager (25.5%), and General Manager (11.5%). Together, those three groups account for nearly two-thirds of the sample.
More importantly, these operators tend to be the decision-makers in technology adoption. When asked directly about authority over inventory technology purchases:
- 54.8% are the sole decision-maker
- 27.5% are the primary decision-maker with input from others
- 82.2% have decisive authority over purchasing decisions
In most B2B surveys, many respondents can influence a purchase but not authorize one. Here, over 80% can do both.
Experience level
This is a veteran cohort, and that matters for how you interpret the data:
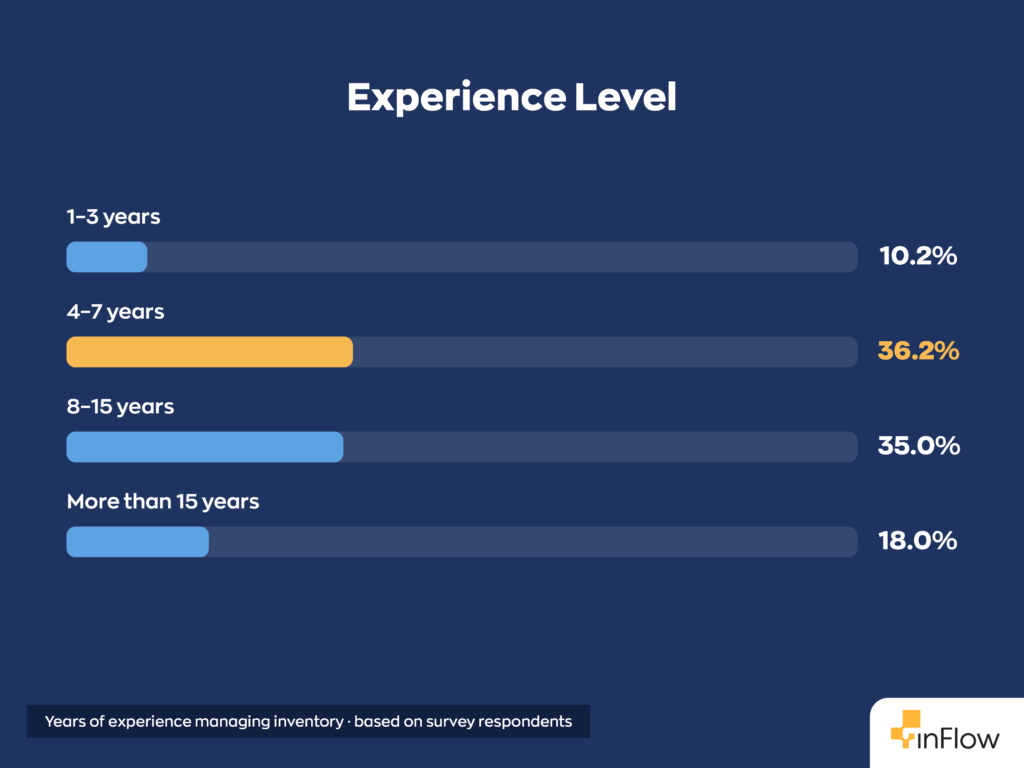
89.2% have four or more years of direct operational experience. Messaging that assumes unfamiliarity with basic concepts will miss. These operators have seen trends come and go. They know what has worked for them and trust those processes.
The Companies
Despite being framed as a small-to-mid business survey, the revenue distribution is wider than you might expect:
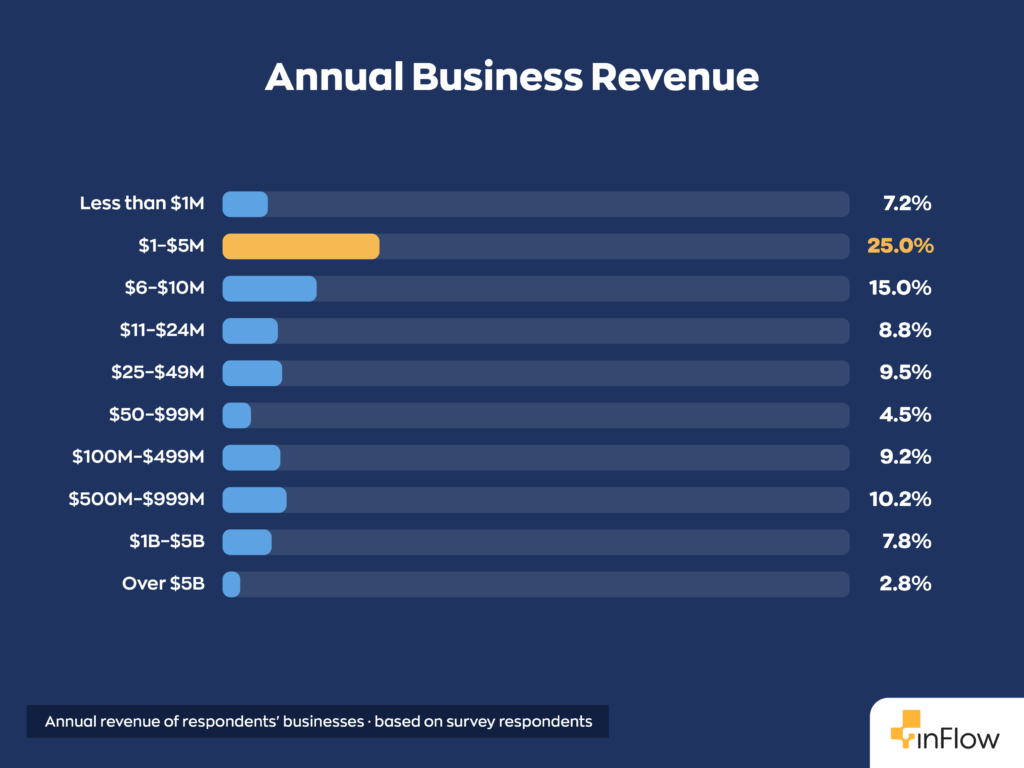
30% report revenue above $100M. 35% employ 500 or more people. This is not exclusively an SMB dataset. It spans founder-operated businesses and enterprise operations teams sitting under the same survey responses.
Another thing to note is the company maturity skews toward experience: 56% have been in business for more than 10 years, and only 5.8% are 1–3 years old.
The industries covered
Construction is the largest single industry at 25.5% (n=102), followed by Industrial (9.5%) and Automotive (9.5%). Responses span 33 sectors including Consumer Products, B2B Services, Technology, Healthcare, Logistics, and more.
How operators track inventory today
One area we were particularly interested in was how businesses track and manage inventory, from day-to-day processes and inventory valuation methods to software adoption. Here’s what we found.
Spreadsheets still dominate
Let’s just say it plainly: Excel is the real competition to inventory management software. These are the most widely used inventory tracking tools, ranked:
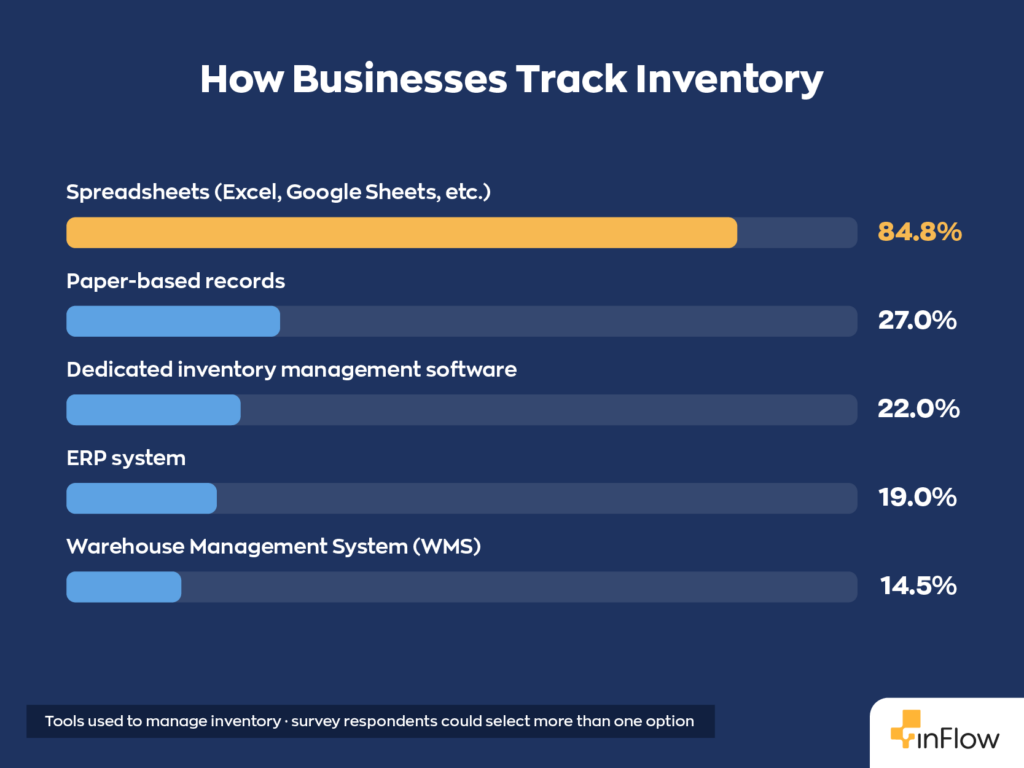
Spreadsheets win at every company size. Among companies with 500+ employees, 53% rely primarily on spreadsheets. This tells us that spreadsheet usage isn’t just a small-business phenomenon; it’s the industry default.
The most common tooling combinations break down like this:
- Spreadsheet only: 52.5% of all respondents
- Spreadsheet + paper: 21.8%
- Software only: 11.2%
- Spreadsheet + software: 9.2%
- Paper only: 3.8%
In total, 74.2% of operators use spreadsheets as their sole or primary tool, with no dedicated software in the mix.
Satisfaction with current tools
Here’s where things get interesting. 92% of operators report being satisfied (very or somewhat) with their current inventory management approach. Dissatisfaction sits at just 3%.
Notably, satisfaction is higher among inventory software users (51% “very satisfied”) than spreadsheet-only users (46.8% “very satisfied”). Spreadsheet users, however, still report satisfaction rates above 90%. The difference isn’t whether users are satisfied, but how strongly they feel about their systems.
This raises an interesting question: if satisfaction is already high across the board, what motivates businesses to change? Many still report challenges with inventory accuracy, visibility, and efficiency, suggesting there may be a gap between what works today and what’s possible with different tools and workflows.
Replenishment methods
Most operators don’t rely on a single replenishment strategy. Instead, they combine multiple methods to decide when and how much inventory to reorder. Here’s what they’re relying on most.
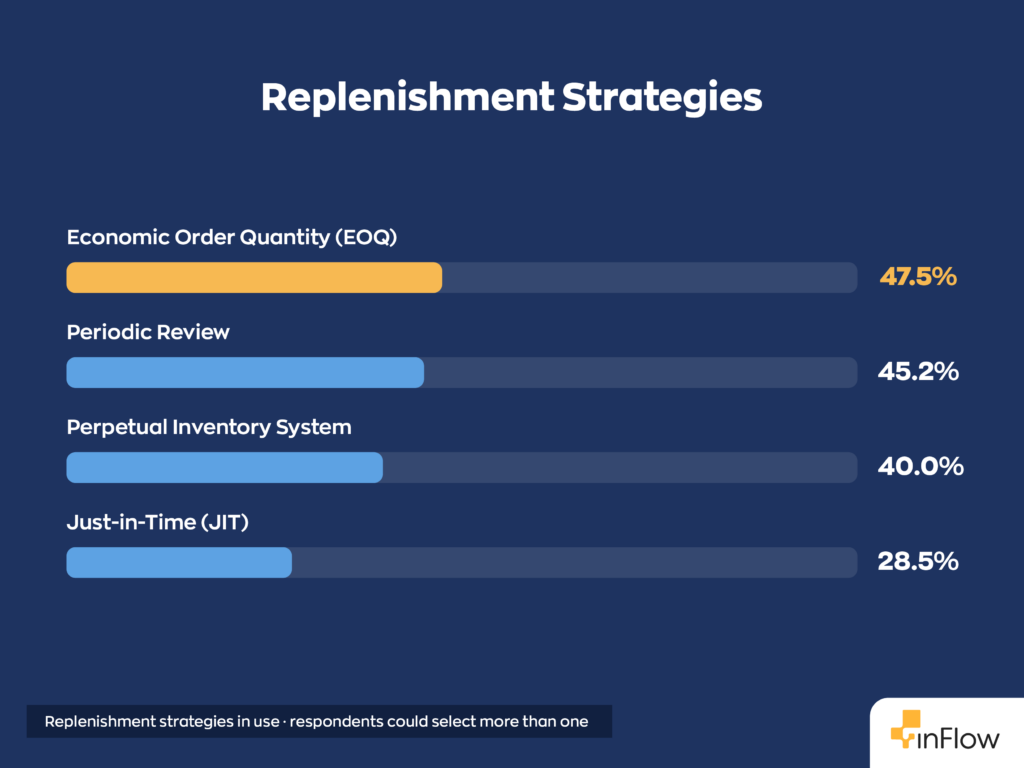
Just-in-time (JIT) inventory may be one of the most talked-about replenishment strategies in trade publications and industry discussions, but it’s among the least-used methods in practice coming last with 28.5%. Meanwhile, periodic review, a far less glamorous approach, remains the dominant replenishment method by a wide margin of 45.2%, neck and neck with Economic Order Quantity, which came in at number one with 47.5%. Perpetual inventory systems weren’t far behind with 40%.
Costing methods
How businesses account for inventory costs varies more than you might expect. While FIFO is the dominant method, many operators choose alternatives that better suit their products, purchasing patterns, or accounting requirements.
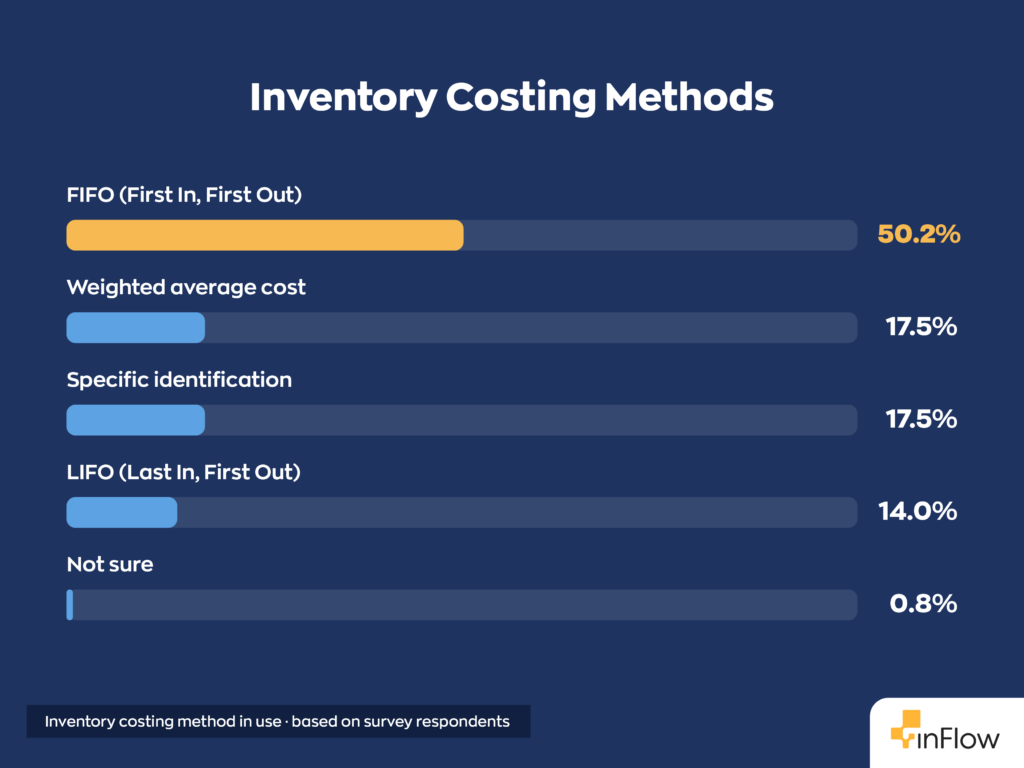
FIFO leads by a wide margin at 50.2%, which aligns with both accounting best practices and the fact that LIFO is banned under IFRS, so it should come as no surprise it sits last at 14%. Weighted average and specific identification are tied at 17.5% each.
Operational performance benchmarks
The following data represents what operators self-report about their current performance. With that in mind, use these as directional benchmarks rather than hard industry standards; context matters heavily depending on your sector.
Order accuracy
Every picking, packing, and shipping process introduces opportunities for error. Measuring order accuracy helps reveal how consistently businesses deliver the right products to the right customers. Here’s what operators reported.
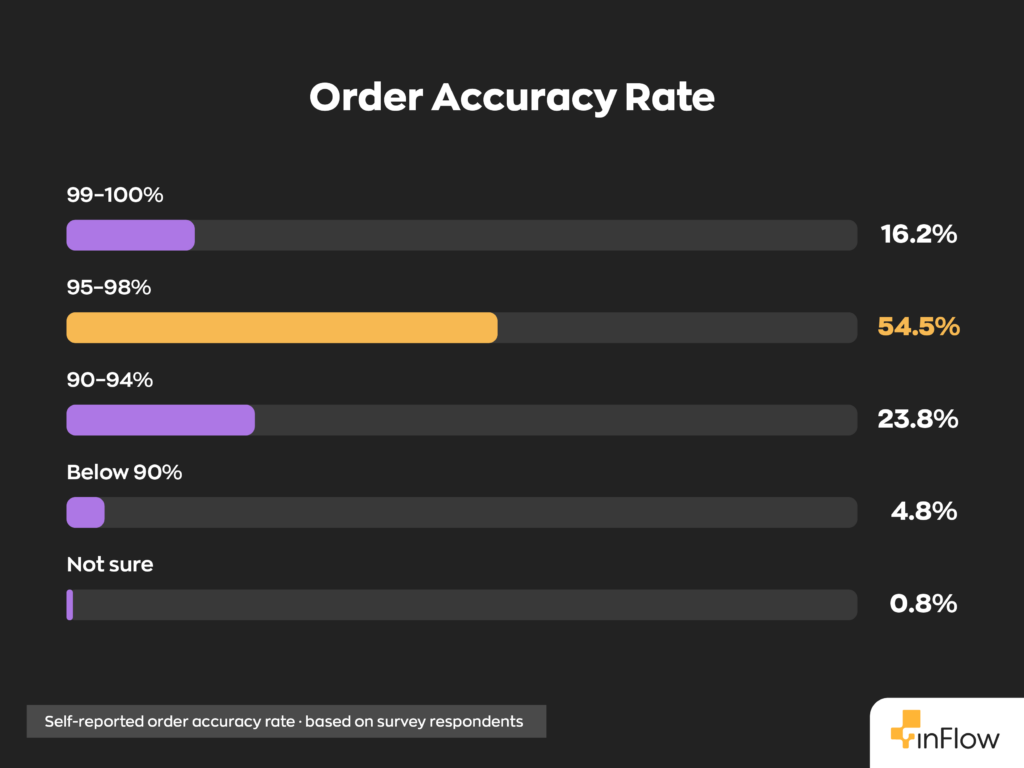
Roughly 55% of operations run at 95–98% order accuracy. Only 16% reach 99–100%. To put that in perspective: at 10,000 orders per year, the difference between 98% and 99% accuracy is 100 more errors. That’s 100 more unhappy customers, 100 more returns to process, 100 more opportunities for churn. Only 23.8% had order accuracies of 90-94%, and just 4.8% had order accuracies below 90%.
Inventory turnover
Inventory turnover isn’t universal. It varies significantly by industry and operating model, as shown in our survey sample.
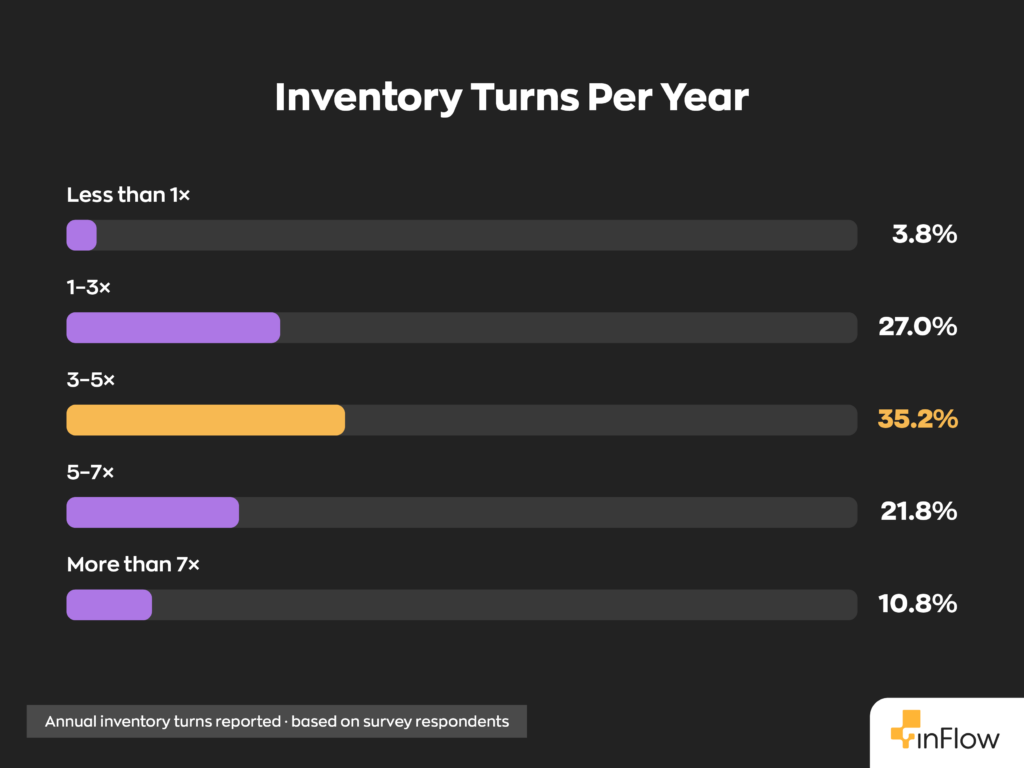
35.2% of operators turn inventory 3–5 times per year. Keep in mind that industry context matters heavily here. For instance, a construction materials distributor and a consumer products company should not be using the same benchmark. The survey also shows 27% of businesses reporting inventory turns of 1-3 times per year, 21.8% with 5-7 times, and 10.8% of more than 7 times. A tiny percentage of only 3.8% turn less than 1 time per year.
Inventory shrinkage
Inventory shrinkage is a cost that every goods-based business will have to absorb. Here’s what our survey uncovered regarding just how much businesses are dealing with.
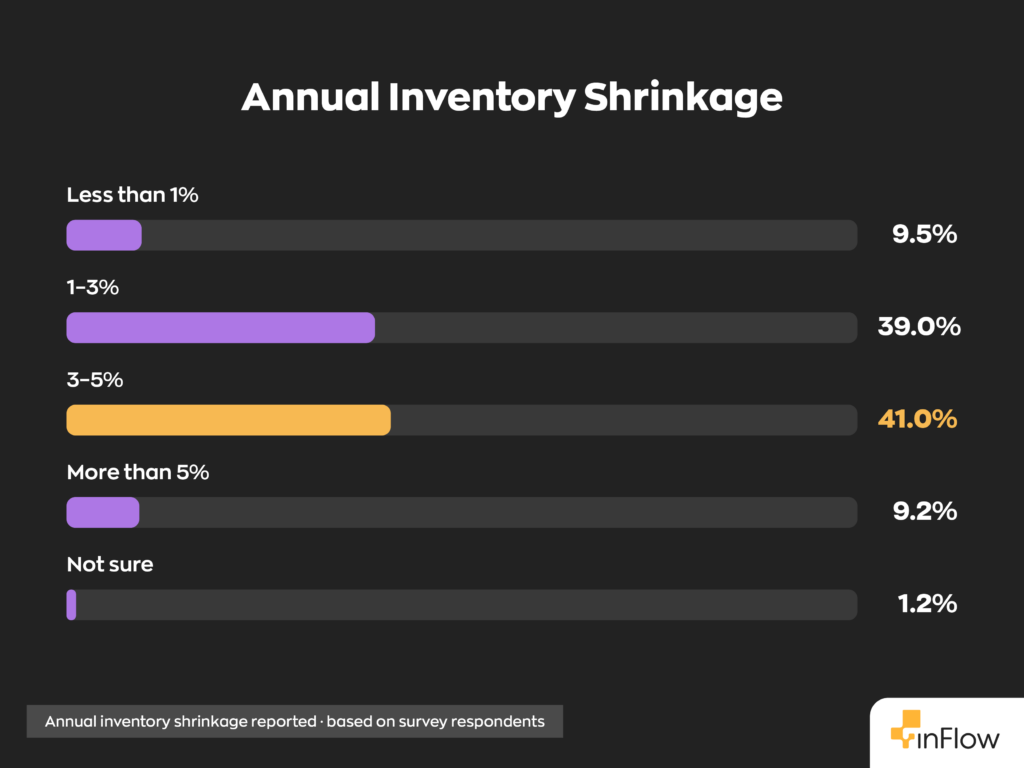
80% report shrinkage between 1–5% annually, with the largest single band (41%) falling in the 3–5% range. Only 1.2% are unsure of their shrinkage rate, which is a positive sign for measurement maturity across the board. Coming in second was the 1-3% range with 39%, and an impressive 9.5% of respondents reported an annual shrinkage of less than 1%
Fill rate
A major KPI for inventory managers is fill rate, which measures how often you can fulfill an order entirely from existing stock without a reorder or a partial shipment. Here’s what the data says about where operators currently sit.
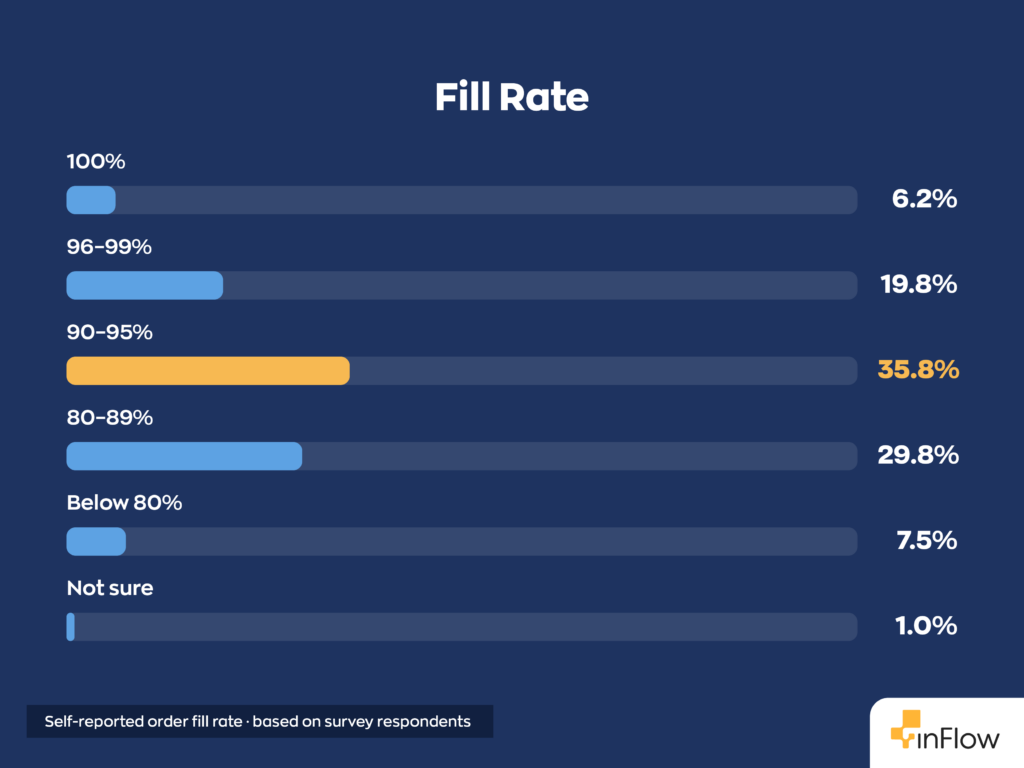
The highest cohort was 35.8%, which fulfilled 90–95% of orders from existing stock without reordering. But 29.8% of operators are fulfilling 80–89% of orders. What does it mean? At least 1 in 10 orders requires a reorder or partial shipment. That’s a meaningful gap in operations and customer experience. Only 6.2% reported a fill rate of 100%, and 19.8% reported 96-99%. Thankfully, only 7.5% saw fill rates below 80%.
Stockout frequency
One of the most direct indicators of inventory health is the frequency of stockouts your business experiences. It’s also the most costly in terms of lost sales and customer trust.
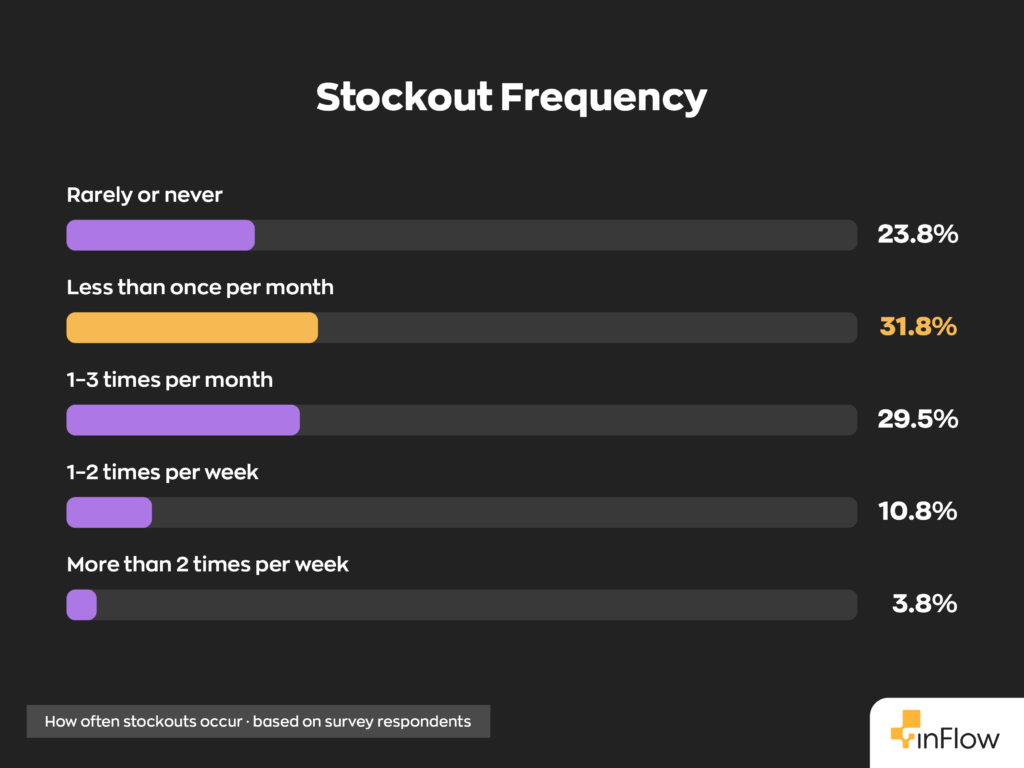
44% of operators experience stockouts at least once a month, 10.8% say they have 1-2 per week, and another 29.5% say they have 1-3 per month. A further 31.8% experience them less than once a month, with only 23.8% of operations being genuinely stockout-free or close to it. If you’re in that 44%, you’re not alone, but you’re also leaving money on the table.
Order fulfillment speed
Speed of fulfilment is an increasingly visible metric. Customers notice, even in B2B, when items take longer then normal to arrive once they’ve been ordered. Here’s how long it takes operators to fulfil an order after it’s been placed.
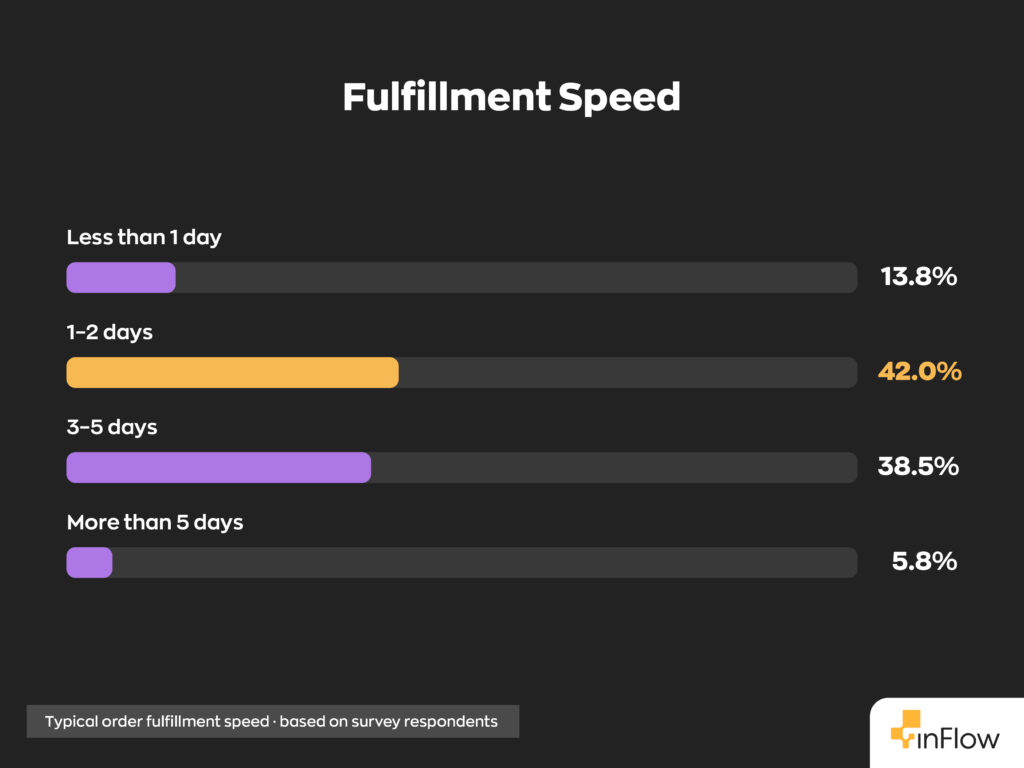
55.8% fulfill within 1–2 days. However, 38.5% take 3–5 days. This is a larger share than you might be expect, especially in the modern day. Speed expectations are only going up; the 3–5 day cohort represents a meaningful competitive exposure. Only 13.8% fulfill orders in less than 1 day, and 5.8% take more than 5 days.
How operators measure efficiency
The metrics listed above are a handful of useful metrics that businesses use to measure how successful their inventory management is. But which of these metrics do they actually track and value the most? Here’s what the results of the survey tell us.
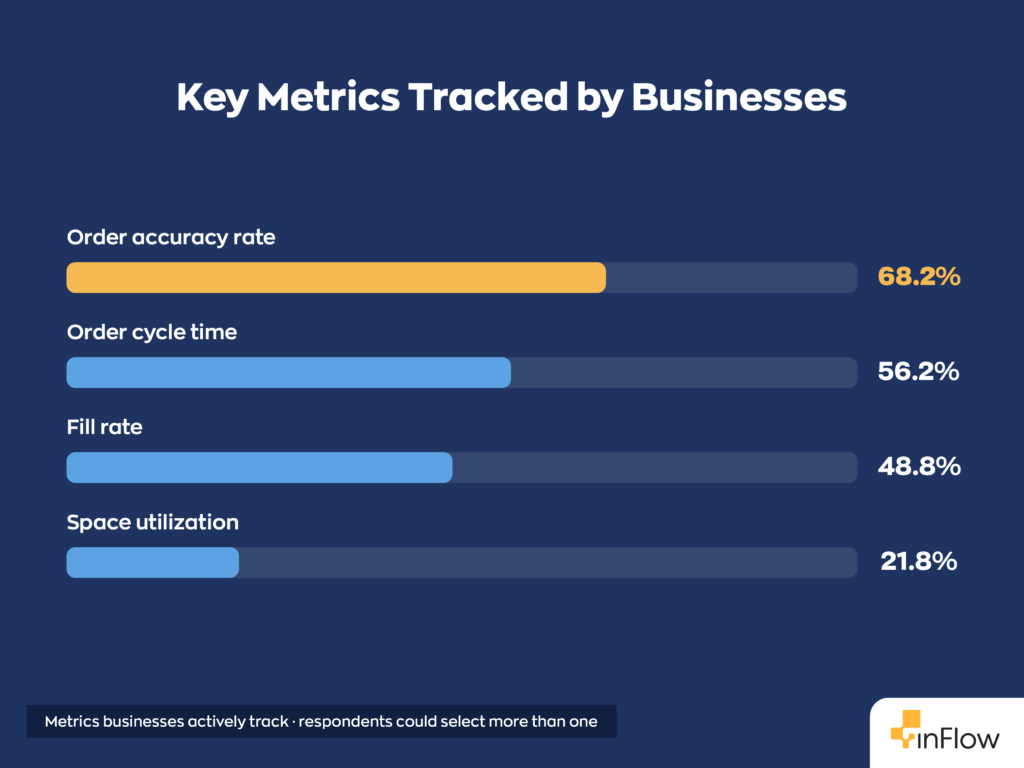
68.2% of respondents say they track order accuracy as a key metric for inventory health. What’s interesting is that most operators track the output of their warehouse rather than the input.
For example, space utilization. While it was one of the top-cited warehouse challenges, only 21.8% actually measure it. That’s a notable gap between what frustrates operators and what they actually track. It may also come as a surprise that only 56.2% of businesses are tracking their order cycle time, with even less tracking fill rate at 48.8%.
The cost environment
Running an inventory operation in 2026 means absorbing pressure from multiple directions at once. We asked operators to name their single biggest source of cost pressure over the past 12 months, and the result was one of the most even three-way splits in the entire survey
Where businesses are feeling the most cost pressure
Operators were asked to name their single biggest source of cost pressure over the past 12 months, and here’s how they answered.
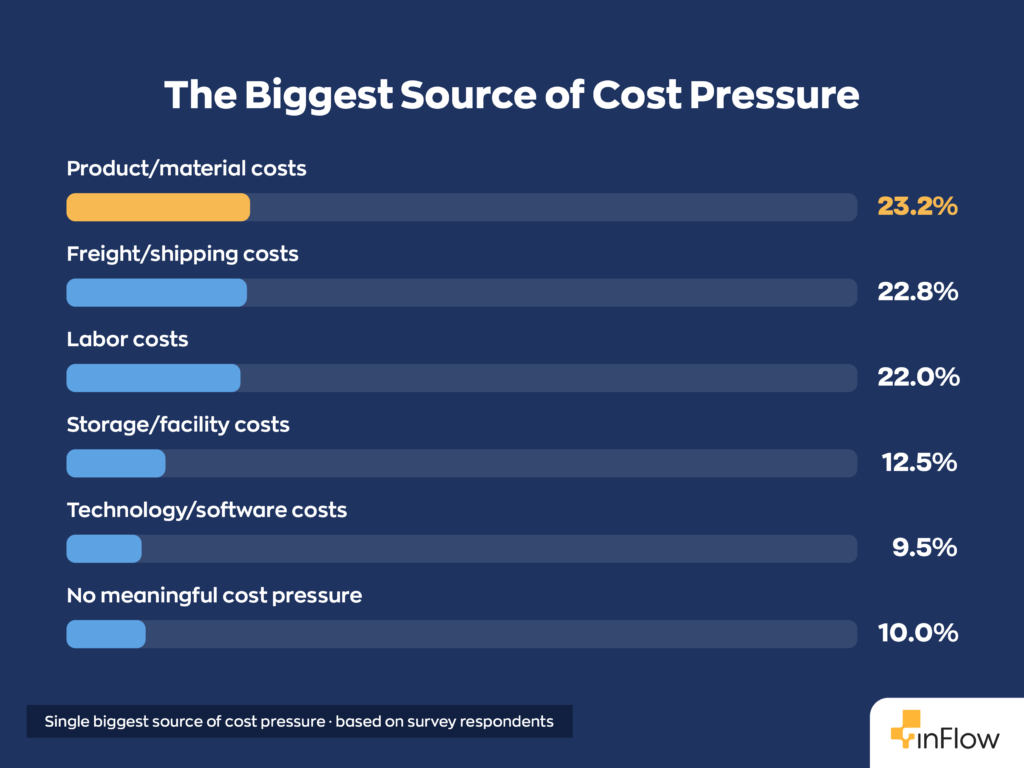
There’s no dominant villain in the cost story. Materials (23.2%), freight (22.08%), and labor (22%) are each squeezing roughly 1 in 5 operators hardest, an unusually even split. Further down the list, we see another pretty close split between storage costs (12.5%) and technology (9.5%). Only 10% report no meaningful cost pressure.
How costs have moved
When it comes to the recent change in costs, the numbers here are striking:
- Freight costs: 24.2% increased significantly and 40.2% increased somewhat. This means that in total, 64.5% of businesses saw their freight costs increase. Not surprisingly only 5.8% saw freight costs decline.
- Material/product costs: 16.2% increased significantly and 47.0% increased somewhat. This means that in total, 63.2% of businesses saw their material costs increase. While only 7.0% saw materials costs decline.
Roughly two-thirds of operators saw both freight and material costs rise over the past year. When both are rising at the same time, there’s very little room to manage margins through cost-side optimization alone. Operational efficiency becomes the lever for reducing overhead.
The defensive stockpiling response
When costs rise and supply chains feel uncertain, operators buy ahead. And the data confirms it.
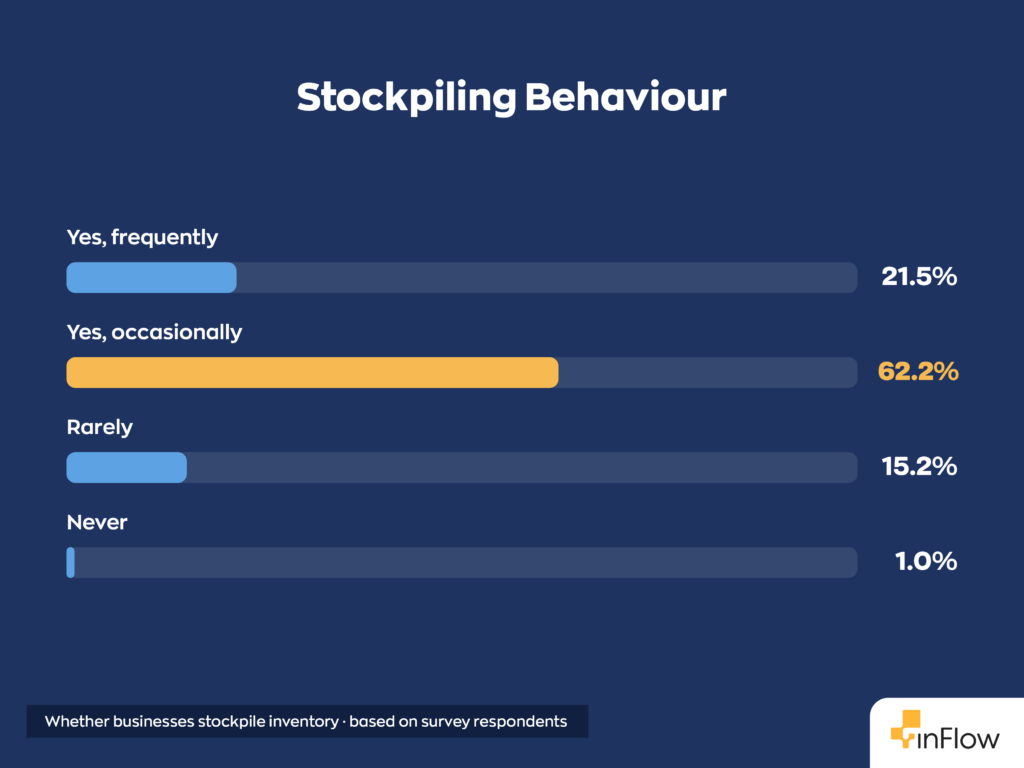
83.8% of operators buy ahead at least occasionally, with 21.5% saying they stockpile frequently and 62.2% saying they do it occasionally. A mere 15.2% say they rarely purchase excess inventory. That’s a rational response to cost uncertainty, but it comes with an increase in carrying costs.
Holding costs
Buying ahead to hedge against cost uncertainty makes sense to most businesses, but that decision isn’t free. We asked operators what they’re actually paying to hold inventory, as a percentage of its value.
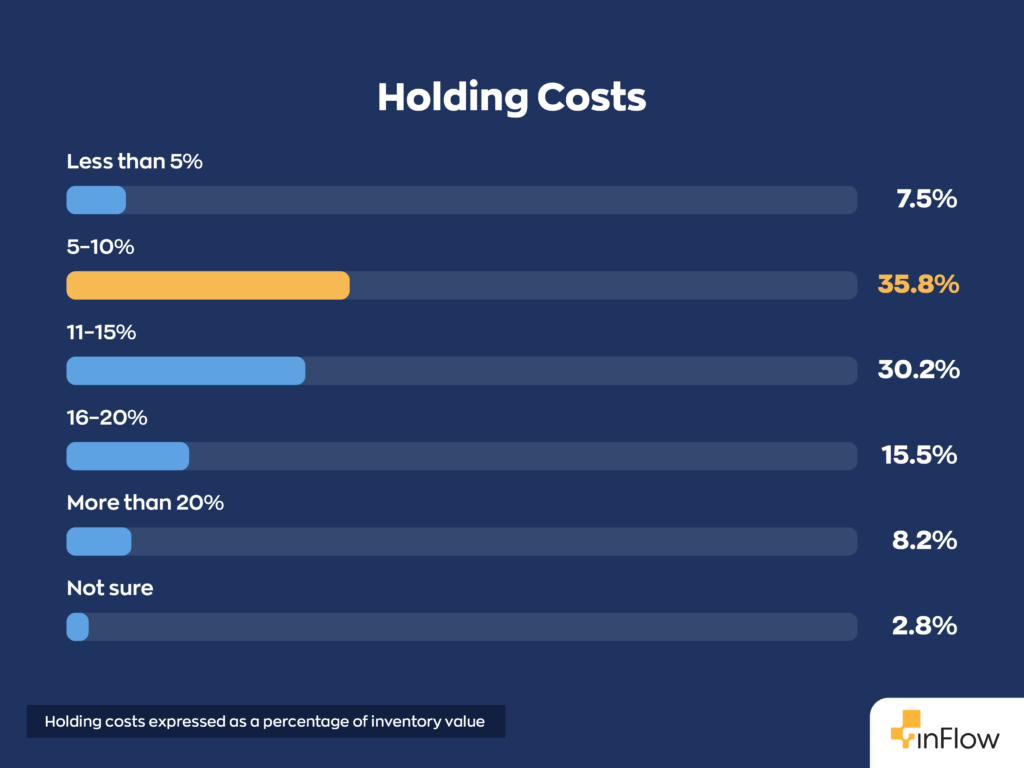
54% of respondents report holding costs above 10% of inventory value. This is reflected in 30.2%, which reported holding costs of 11-15%, 15.5%, which reported 16-20%, and 8.2%, which reported more than 20%. For an operation carrying $500K in inventory at a 12% holding cost, that’s $60,000 per year just to hold what’s on the shelf, and that’s before shrinkage, stockout losses, and write-offs. Only 7.5% reported holding costs of less than 5%, with the highest percentage going to the 5-10% range, with 35.8%.
That’s where demand forecasting tools become less of a “nice to have” and more of a financial necessity. Tools that help you calibrate reorder points based on historical sales patterns and lead times can reduce the holding costs without increasing stockout risk.
Technology: what they have vs what they want
Inventory management has always been technology-driven. Starting with the clipboard (at one point, this was considered state-of-the-art), to barcodes, all the way to modern ERP systems. But the gap between what operators are using today and what they want to be using next tells an interesting story about where the industry is headed
Current technology adoption
First, let’s take a look at what businesses are already using.
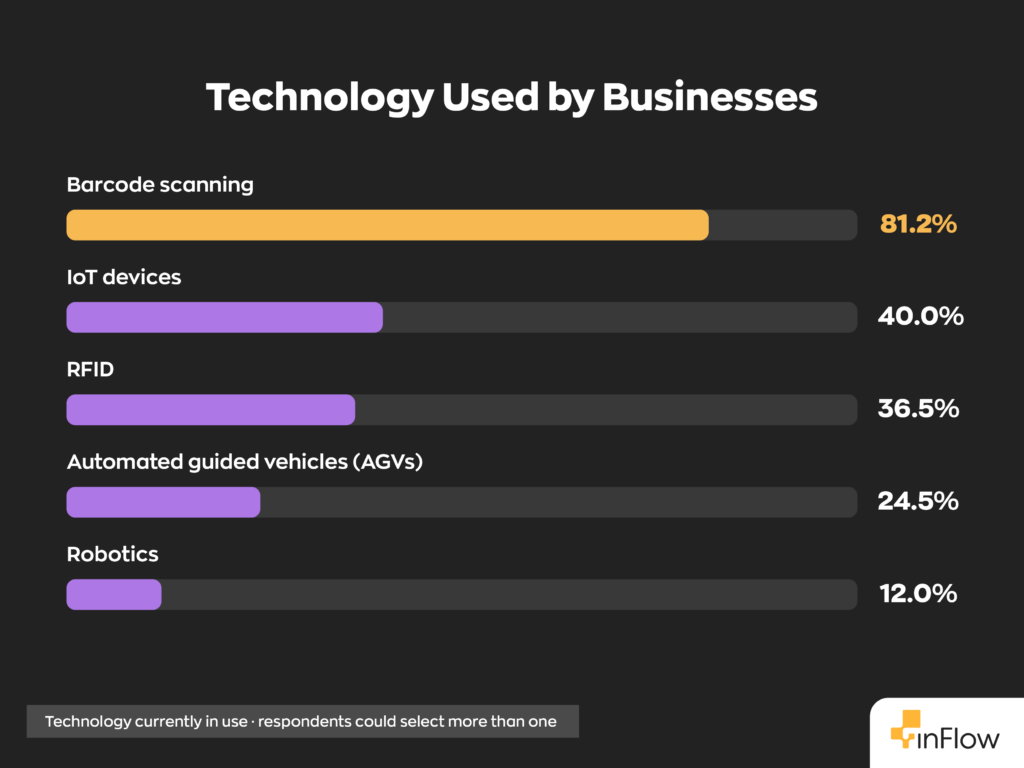
It should come as no surprise to inventory managers that barcode scanning comes out on top with 81.2%. It’s a mature, near-universal technology. IoT devices (40.0%) and RFID (36.5%) have meaningful adoption but are far from standard. Robotics, despite significant industry coverage, is used by only 12.0% of respondents. Something we weren’t expecting was just how many businesses reported adopting automated guided vehicles, with 24.5%.
What they want next
Current tools tell us how businesses operate today. Interest in new technologies offers a glimpse into where they see the greatest opportunities for improvement. Here’s what operators are most interested in implementing next.
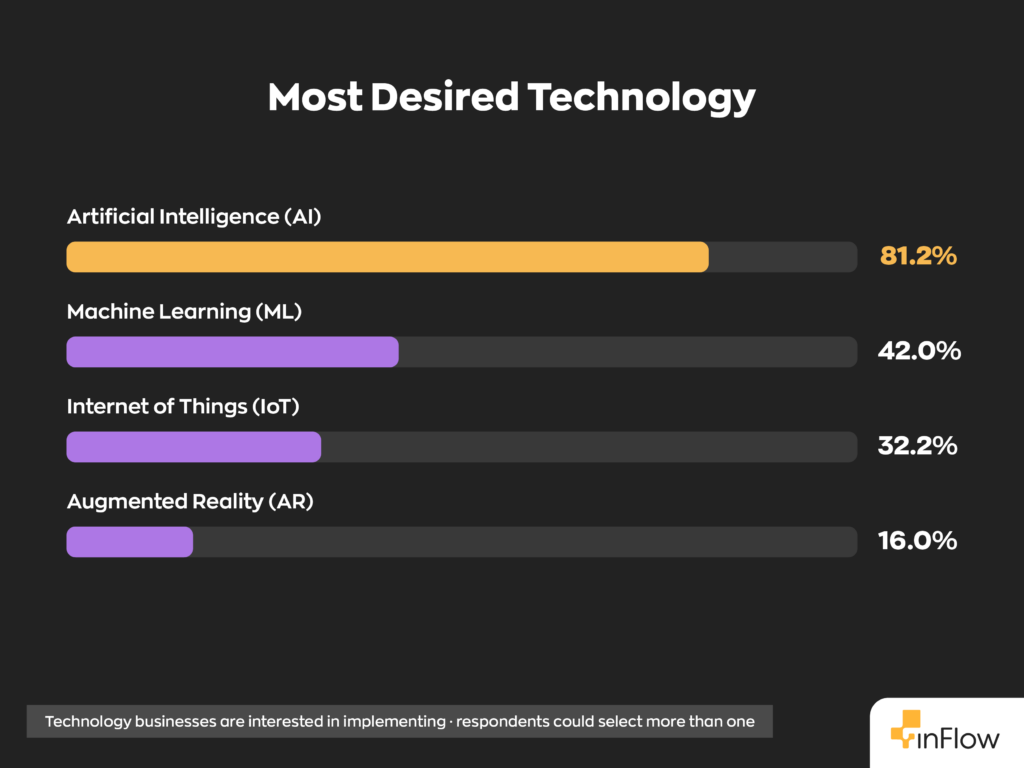
Here’s the number that should stop you in your tracks: AI interest is at 81.2%. This number exactly matches barcode scanning’s current adoption rate. Machine Learning follows at 42%, with IoT (32.2%) and AR (16.0%) trailing significantly.
What’s blocking implementation
The interest in new technology is clearly there, so what’s standing in the way? Here’s what operators say is holding them back.
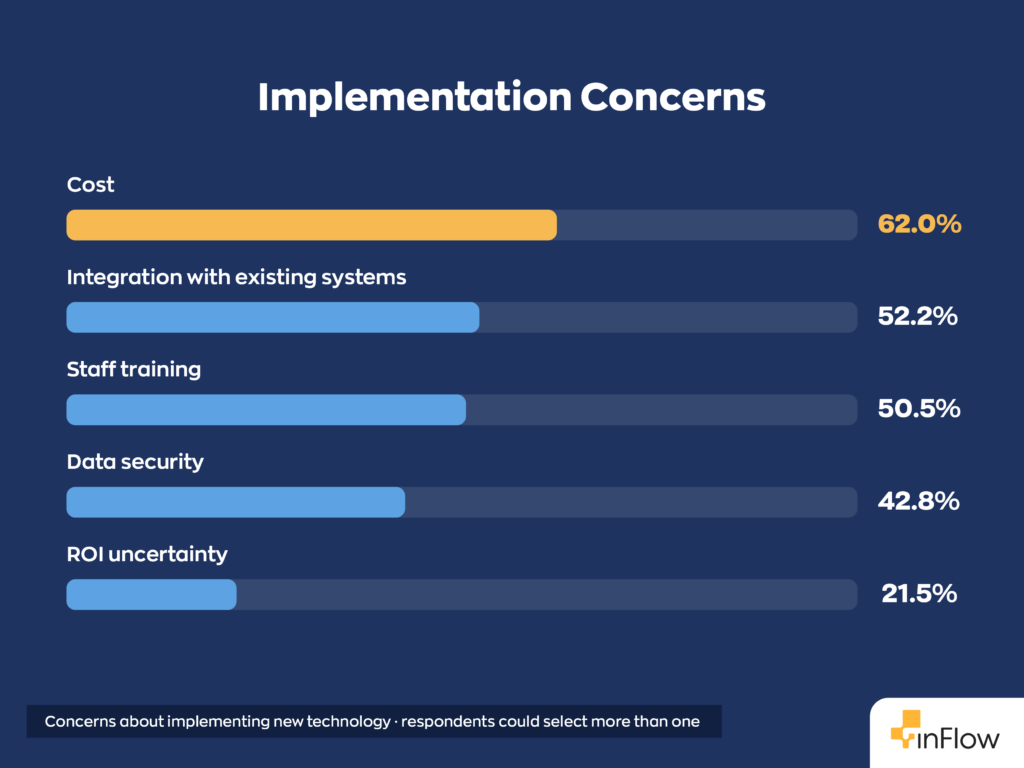
ROI uncertainty is dead last at 21.5%. Operators believe new technology works. Their concerns are operational: Can we afford it? Will it connect to what we already have? Can our team actually use it?
For vendors, that’s an important distinction. Leading with ROI calculators may miss the real issue. Addressing cost, implementation, integration, and ease of adoption is likely to resonate far more with businesses. Cost seems to be the leading concern at 62%, followed closely by integration with existing systems at 52.2%, staff training at 50.5% and data security at 42.8%.
The AI engagement gap
62.8% stay informed via industry conferences, the highest single channel. Only 11.0% use LLMs or AI tools to stay informed.
The same operators who say they want to implement AI in their warehouse are not yet using AI in their day-to-day information work. The aspiration and the behavior haven’t connected yet. This is a pretty standard early-adoption pattern: the interest is genuine, but businesses have yet to take that first step.
Challenges and priorities
High satisfaction scores don’t necessarily mean operators think everything is running perfectly. When asked where they experience the most friction, a much more nuanced picture emerges.
Inventory management challenges
Beyond technology, we asked respondents where the real friction lies. What’s slowing them down day to day, and where they’re focused on making improvements. Here’s how they responded.
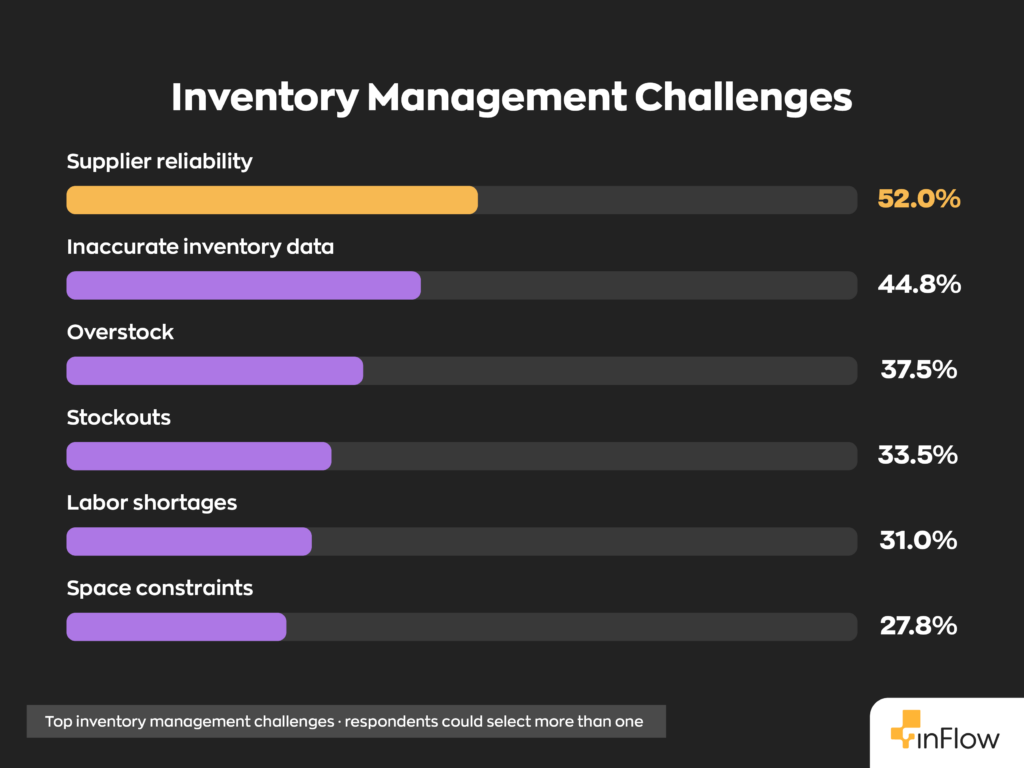
Supplier reliability tops the list at 52%. Since this is outside the operator’s direct control, it’s one of the most frustrating challenges to manage. Inaccurate inventory data (44.8%), on the other hand, is the challenge most directly addressable through improved systems and processes. Further down the list, we see overstock (37.5%), stockouts (33.5%), labor shortages (31%), and space constraints (27.8%).
Warehouse management challenges
Inventory challenges don’t exist in isolation, they show up on the warehouse floor too. Here’s what operators flagged as their biggest day-to-day operational pain points
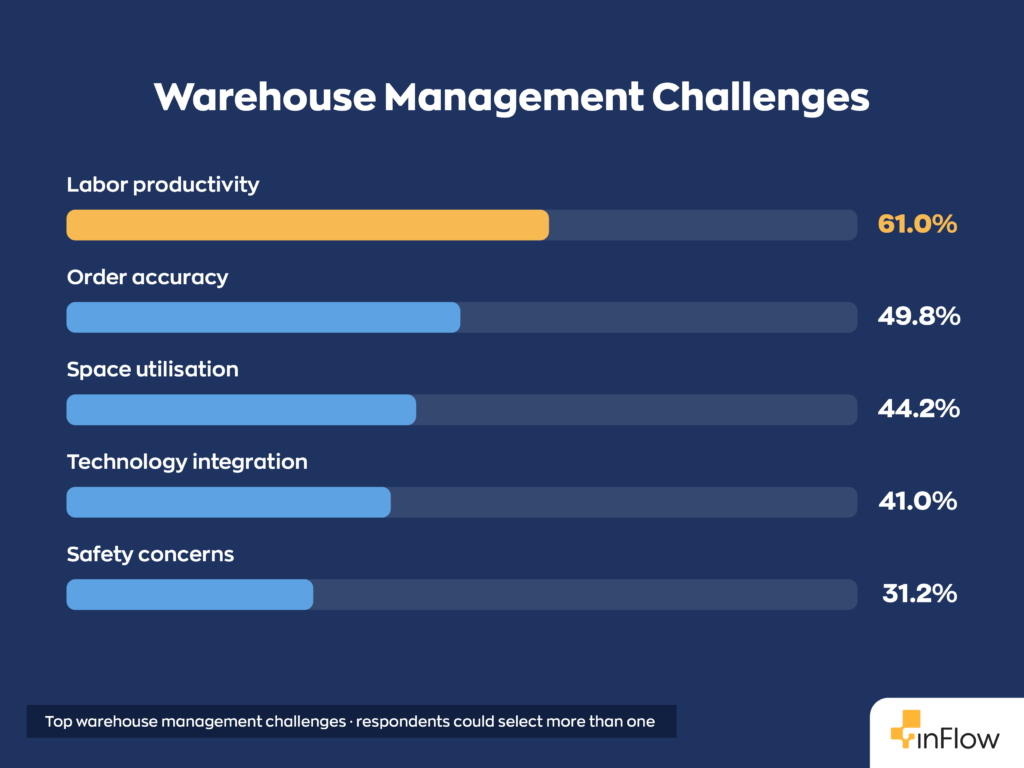
Labor productivity is the dominant warehouse challenge at 61%. Technology integration (41%) is the fourth-ranked challenge and the second-ranked 12-month priority, suggesting operators have already identified the connection: better technology is the path to better labor productivity. The rest of the list has responses pretty evenly split. Order accuracy sits at 49.8%, space utilization at 44.2%, technology integration at 41%, and safety concerns at 31.2%
12-month priorities
Businesses only have so many resources to invest in operational improvements. That means every project competes for the same time, budget, and attention. To see where those priorities lie, we asked operators which initiatives they plan to focus on over the next 12 months. Their responses provide a snapshot of the trends shaping inventory management in the year ahead.
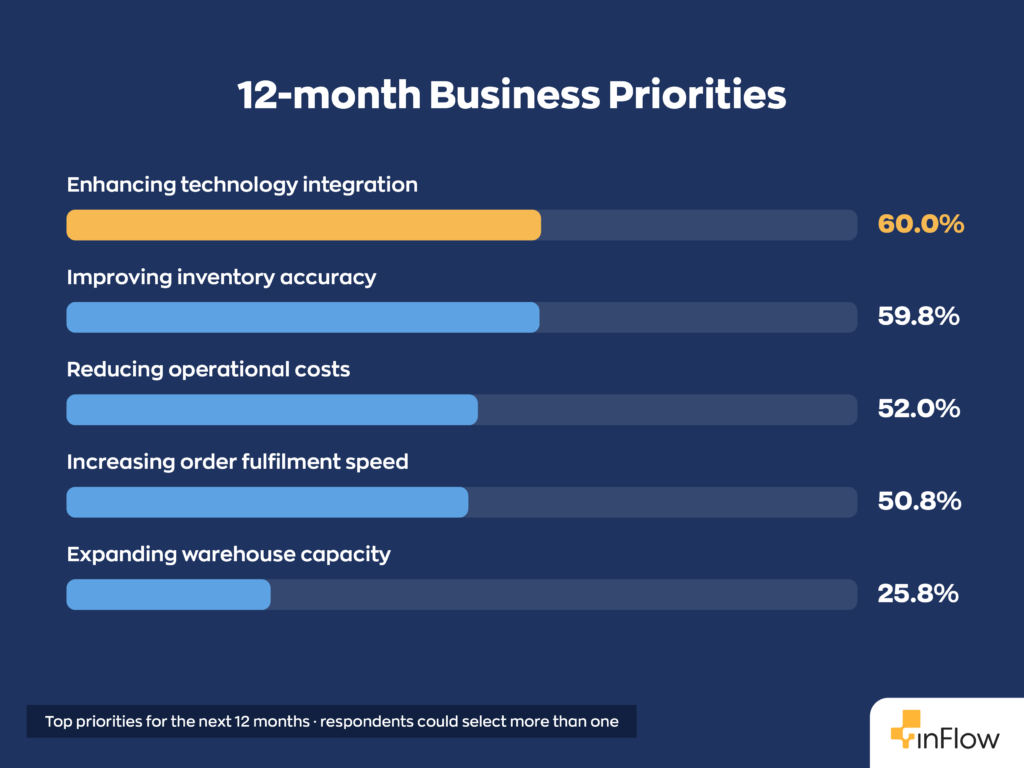
Four priorities are essentially tied at the top: integrating technology (60%), inventory accuracy (59.8%), reducing costs (52%), and increasing fulfillment speed (25.8%). Expanding warehouse capacity came in dead last at only 25.8%, suggesting businesses are looking to make the most of the space they currently have.
The challenge/priority pairing tells a coherent story: operators know supplier reliability and inaccurate data are slowing them down, and they’re planning to fix it through technology and accuracy improvements. The roadmap is clear. The gap is execution.
The satisfaction paradox
The single most important finding in this report doesn’t appear in any single question, it emerges from the pattern across several.
As we mentioned above 92% of operators are satisfied with their current inventory management approach. That figure is real. It’s not a rounding error or a data artifact. When asked directly, these professionals say they’re happy with what they have.
But then:
- 49.5% say inventory accuracy needs the most improvement
- 44% experience stockouts at least monthly
- 52% cite supplier reliability as their biggest challenge
- 44.8% flag inaccurate inventory data as a top challenge
- 60% have technology integration as their #1 priority for the next 12 months
High satisfaction alongside significant operational problems is a known pattern in mature industries. When people have used a system for years and built workarounds for its limitations, they often anchor their satisfaction to the world they know rather than the performance they’re missing. In other words, “you don’t know what you don’t know”.
The opportunity here isn’t to tell these operators they’re wrong. They’re not wrong; their operations continue to run. The opportunity is to show them what “running well” actually looks like, and let them decide whether they want to fix what they think “isn’t broken”.
Validated by inFlow customer data
Survey data tells you what a market thinks. Customer data tells you what actually happens when they act on it.
We cross-referenced the findings in this report against inFlow’s own customer feedback. Through nearly 4,000 structured observations drawn from support tickets, sales calls, Zoom recordings, and customer emails across 293 companies, to see where the two datasets converge.
We found three things in particular that are corroborated by strong, consistent signals from real operators in the field.
1. The spreadsheet breaking point is real, and it looks the same every time
The survey shows 85% of operators using spreadsheets, with 92% reporting satisfaction. Customer data adds the dimension the survey can’t capture: what happens right before someone switches.
The manual inventory systems cluster in inFlow’s customer feedback is the most consistently negative theme in the entire dataset, 93% negative sentiment across 159 data points, with zero positive signals over 16 consecutive weeks. The language customers use when they finally reach out is strikingly uniform:
- “Using spreadsheet — taking too much of her time, lots of human error”
- “Just a mess trying to keep track of the items”
- “Multiple spreadsheets and going through emails… if you forget to update one, all the formulas get messed up”
- “No longer sustainable due to business growth”
- “Constant double entry between two separate systems”
The survey captures the stable state: operators who have adapted to their spreadsheets and report satisfaction. Customer data captures the breaking point. The 85% on spreadsheets includes a meaningful subset who are one growth event away from a potential operational breakdown.
2. Low-stock visibility is the most-requested capability in the customer base
The survey identifies inaccurate inventory data (44.8%) and stockouts (33.5%) as top inventory management challenges. In inFlow’s customer feedback, inventory reorder automation, which covers low-stock alerts, reorder points, and demand-triggered notifications, is the second most active feedback cluster by company count, with 27 distinct companies raising it over the past 16 weeks.
The requests are granular and operational, not aspirational:
- “Low stock notifications and reorder point management are critical requirements due to a past incident of believing stock was available when it wasn’t”
- “That’s gonna be important — reordering and forecasting, that’s where we really need help”
- “Does it count how many you’ll need soon? Like, forecasting? Is there a forecasting area?”
The survey names the problem. Customer data shows it being lived, in detail, by businesses that are already trying to solve it.
3. Demand forecasting is the specific AI use case operators actually want
The survey finding that 81% of operators want AI is striking but broad. The customer data makes it specific: when operators describe what they want AI to do, the answer is almost always some form of demand forecasting and automated replenishment, not chatbots, dashboards, or general intelligence.
- “Demand forecasting that suggests purchase order quantities based on sales velocity”
- “Based on last year’s sales, I’d like to upload historical data and see what it produces going forward”
The gap between the survey’s 81% AI interest and the 11% who currently use any AI tool is partly a product gap. The AI use case operators want most is smart, data-driven replenishment and it’s not yet ubiquitous in the tools they use. Interest is waiting for a specific capability to catch up to it.
4. Manual process overhead is the hidden cost behind the labor productivity challenge
The survey’s #1 warehouse challenge, labor productivity, cited by 61%, is typically framed as a staffing or efficiency problem. Customer data reframes it as a systems problem. The complaints aren’t about workers being slow; they’re about workers being forced into repetitive manual work that software should be handling:
- “Two separate systems — invoicing/ordering — constant double entry”
- “If I’m gone one day, other people from marketing are taking stuff and not recording it”
- “You get to a point where the workarounds almost make it more complex and the negatives begin to outweigh the positives”
When operators say labor productivity is their top warehouse challenge, they’re largely describing the cost of running operations that outpaced their systems. The headcount isn’t the problem. The data infrastructure is.
Methodology
This report is based on an online survey of 400 full-time employed professionals who work in warehouse, inventory, supply chain, or operations management roles. The survey was fielded in March 2026.
Respondents were recruited via online panels and screened for full-time employment. All 400 respondents completed the survey in full. No partial completes were included.
The survey covered 38 questions across six topic areas: respondent and company profile; inventory tracking methods and tools; operational performance benchmarks; cost environment; technology adoption and interest; and operational challenges and priorities.
Industry breakdown (top industries by sample size): Construction (25.5%), Industrial (9.5%), Automotive (9.5%), Consumer Products (4.8%), Business Infrastructure & Equipment (4.2%), B2B Services (4.0%), Technology (4.0%), Construction Material/Supplies (4.0%). 33 industries represented in total.
The survey was conducted by inFlow Inventory in partnership with OvationMR.
Customer feedback data sourced from inFlow’s internal feedback database, covering support tickets, sales calls, Zoom recordings, and customer email correspondence from February–June 2026. Feedback observations were structurally extracted and clustered using semantic analysis; 3,985 nuggets across 293 companies were included in the cross-reference analysis.
FAQ
What percentage of businesses still use spreadsheets for inventory management in 2026?
According to our survey of 400 operators, 84.8% use spreadsheets as their primary inventory tracking tool, including 53% of companies with 500 or more employees. Spreadsheet use is not a small-business phenomenon; it’s the industry default across company sizes.
What are the biggest inventory management challenges in 2026?
Supplier reliability tops the list at 52%, followed by inaccurate inventory data (44.8%), overstock (37.5%), and stockouts (33.5%). On the warehouse side, labor productivity (61%) and order accuracy (49.8%) are the most commonly cited challenges.
How many businesses are planning to implement AI in their inventory operations?
81.2% of operators surveyed say they want to implement AI in their warehouse or inventory operations. However, only 11.3% currently use AI tools in their day-to-day work, a significant gap between aspiration and adoption.
What is the most common inventory replenishment method used by operators?
Economic Order Quantity (EOQ) is the most widely used method at 47.5%, followed closely by Periodic Review at 45.2%. Just-in-Time (JIT), despite being widely discussed in industry content, is used by only 28.5% of operators.
What are operators’ top priorities for inventory management in the next 12 months?
Enhancing technology integration (60.0%) and improving inventory accuracy (59.8%) are essentially tied as the top priorities, followed by reducing operational costs (52.0%) and increasing order fulfilment speed (50.8%).
Why are so many operators satisfied with spreadsheets despite their limitations?
High satisfaction alongside significant operational problems is a known pattern in mature industries. When operators have used a system for years and built workarounds for its limitations, they tend to anchor their satisfaction to the world they know rather than the performance they’re missing. Our customer data shows that the breaking point typically comes with a growth event, when the manual system simply can’t keep up anymore.
What is the average inventory holding cost for operators in 2026?
54% of respondents report holding costs above 10% of inventory value. For an operation carrying $500,000 in inventory at a 12% holding cost, that’s $60,000 per year just to hold what’s on the shelf, before accounting for shrinkage, stockout losses, or write-offs.
0 Comments