

Key takeaways
- Economic order quantity (EOQ), also known as optimum lot size, helps determine how much inventory to order each time to minimize total ordering and carrying costs.
- While reorder points focus on when to order the EOQ focuses on how much to order.
- The standard EOQ formula balances demand, ordering costs, and carrying costs to find the most cost-effective order quantity.
- EOQ helps businesses reduce unnecessary carrying costs, avoid stockouts, and optimize storage space by preventing over-ordering of slow-moving items.
- The EOQ model assumes constant demand, fixed ordering costs, and no stock shortages, which means it doesn’t always reflect real-world conditions like bulk discounts or seasonal demand fluctuations.
Economic order quantity (EOQ) is sometimes called the optimum lot size. It aims to tell you the optimal order quantity for a specific inventory product, so you know how much to purchase each time. The aim is to make ordering as cost-effective as possible.
You might already use a reorder point formula, but EOQ is different from this. If EOQ tells you how much to buy, the reorder point tells you when (in terms of stock levels).
When you’re managing inventory for a range of products or parts, it’s indispensable to know how many units to add to each order. Otherwise, you could face stockouts or over-ordering, both of which cost the business money. Luckily, the EOQ formula can help.
Different economic order quantity formulas
There are a few ways to calculate EOQ, but you might use something like this:
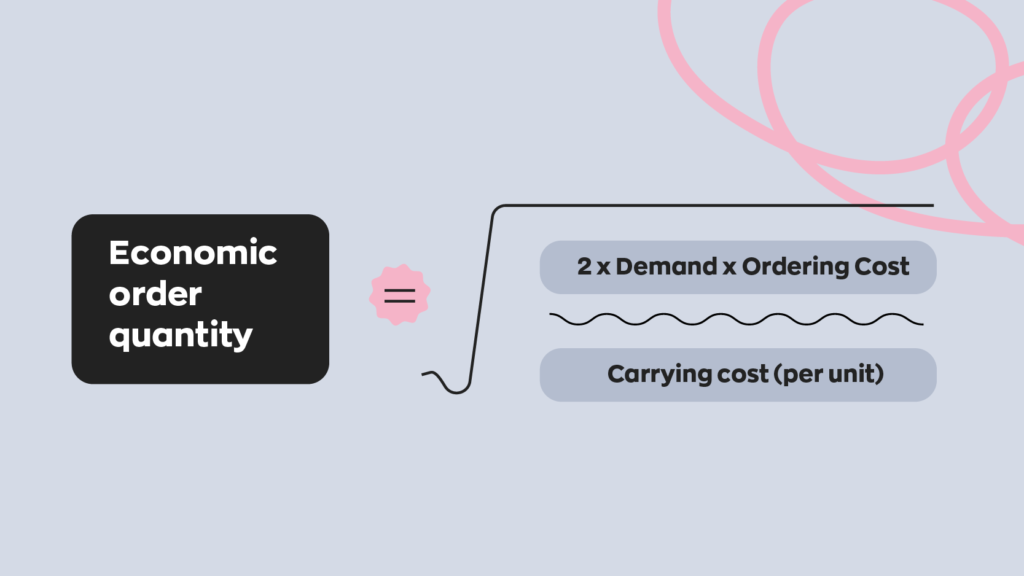
Economic order quantity = the square root of (2 x demand x ordering cost) / carrying cost (per unit).
Let’s break those variables down. Here’s what we mean by each part:
- Demand: How many units you anticipate selling (usually over one year).
- Ordering cost: How much it costs your company to place an order for the items, including transportation fees, order processing, and others. These are fixed costs.
- Carrying costs: How much it costs you to hold the items in your inventory (usually calculated for one unit).
You may also come across EOQ formulas that include other variables. Or, you might see the same formula but written with different symbols.
Whichever formula you choose, be sure to research it and use the right variables so that it works well for you.
It can be a pain to keep all of these formulas straight, so it can be helpful to use an inventory formula cheat sheet with seven of the most common inventory formulas.
Benefits of economic order quantity
No business wants to run out of stock that’s in demand. A 2024 study suggested that two out of three consumers will shop at a different retailer if the product they want isn’t in stock. This is lost business.
Even so, overcorrecting and ordering large quantities can lead to other problems. Storing extra inventory will cost money, tie up cash, and leave less space for other items. Careful use of the EOQ can help to address these issues.
Advantages of the EOQ model include:
- Reducing unnecessary carrying costs: Storing excess stock costs money; carrying costs could total up to 30% of your inventory’s value.
- Aiming to avoid shortages: The formula assumes that no shortages are allowed, aiming to never lose sales. However, this isn’t guaranteed (more on this below).
- Optimizing your storage: By ordering the optimal quantities, you can reduce the space taken up by products that don’t sell well.
The EOQ formula determines how much to order each time to minimize costs. It takes demand, ordering costs, and carrying costs into account to determine the most economical quantity to order.
What are the disadvantages of economic order quantity?
The EOQ formula can be a helpful guide, but it’s not an exact science — even when you input the right numbers. As such, it’s important to keep these disadvantages of EOQ in mind:
- Doesn’t always reflect reality: The formula assumes certain things that don’t always reflect real life. This means EOQ gives an ideal view, but not always the real view. For example, the cost per order doesn’t take into account discounts for bulk buying. So, your supplier might offer you a better deal, but your formula won’t know that. Equally, it doesn’t anticipate stock shortages, which could leave inventory falling short.
- Can produce non-whole numbers: Deciding whether to round up or down isn’t always easy. It may not be too much of an issue for a large retailer to order and store a surplus of low-cost items such as a picture frame, but a small retailer ordering designer couches may feel differently.
- Assumes that demand is constant: In reality, demand for seasonal products will fluctuate throughout the year, which means you’ll need to keep a close eye on when to recalculate your EOQ. You may also experience unexpected or unprecedented demand.
- Can be difficult to calculate on your own: A quick search will pull up a range of online EOQ calculators. Usually, these ask you to input the above numbers to get your total. These can be handy, but they won’t tell you whether you’ve used the right numbers or how accurate the results are.
- Requires detailed and accurate data: This isn’t necessarily a disadvantage, but an important consideration. It can be costly and time-consuming to track the type of information needed to calculate EOQ, but the results will likely justify the expense. The use of inventory tracking and managing software can also make this more convenient, with detailed reports and automation options.
If you’re unsure about any aspect of calculating EOQ, it’s better to find help from a professional. This can help to avoid costly mistakes. You can also gain a more complete picture by using a reorder point calculator. With the EOQ formula and the reorder point calculator, you’ll be able to figure out how much to reorder and when to do so.
Economic order quantity equation example
To get a clearer idea of how you might calculate economic order quantities, let’s look at a quick example. A greeting card store wants to know how many of its hilarious, best-selling birthday cards to order each time it restocks.
There is a yearly demand of 5000 of these birthday cards. Each time the store orders new stock, it costs them $5. There is a $0.10 carrying cost for each card, which includes expenses such as service, risk, capital, and storage costs.
So, the store’s EOQ would look something like this:
√ ([2 x 5000 x 5] / 0.10) = 707.1
![√ ([2 x 5000 x 5] / 0.10) = 707.1](https://www.inflowinventory.com/wp-content/uploads/2022/08/EQO-03-1024x577.png)
This means the store would need to order 707 cards each time.
The key to running a successful business is asking the right questions and learning from mistakes. This means knowing what’s happening across your company, and the EOQ is an important tool in this regard.
Final thoughts on economic order quantity
Economic order quantity isn’t about achieving a perfect number. It’s about making smarter purchasing decisions with the information you already have. When you understand EOQ alongside reorder points, carrying costs, and real demand, you put guardrails around your purchasing decisions. The result is fewer stockouts, less cash tied up on shelves, and a system that’s easier to scale alongside your business.
0 Comments