
 for Retailers")
Average order value (AOV) is a valuable metric for businesses looking to grow. It helps businesses gauge customer spending and identify strategies to increase sales, such as upselling or enhancing product bundles. By focusing on AOV, companies can optimize marketing efforts and improve profitability by helping strategize pricing, marketing, and sales efforts. As a business, you can even use it to improve your demand forecasting.
So today, we’ll get into the nitty-gritty of what AOV is and why it’s such a useful metric. We’ll explore how to easily calculate your business’s average purchase amount, the benefits of knowing your AOV, and some proven strategies to help improve it.
How to calculate average order value
To calculate AOV, start by determining the total revenue generated over a specific period. This data can typically be found through sales reports or your e-commerce platform. Next, count the number of orders placed within the same timeframe. Divide the total revenue by the number of orders to obtain the AOV.
Analyze AOV regularly to spot trends and inform strategies. Use consistent time frames — monthly or quarterly — and consider segmenting data by customer demographics or channels for deeper insight. Incorporating AOV into broader analytics helps assess overall business performance and optimize pricing and marketing initiatives.
Average order value formula
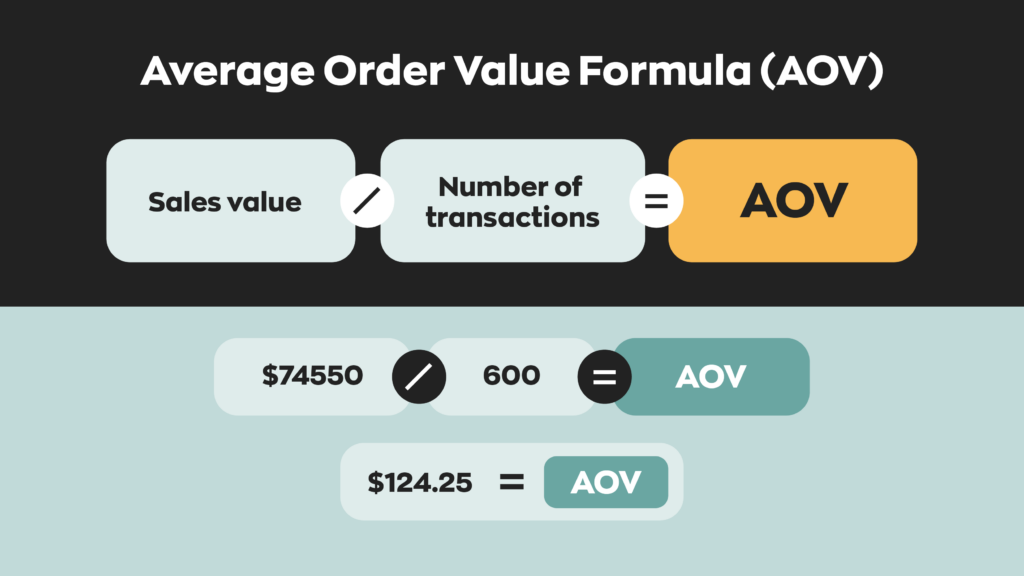
The AOV is a key performance indicator that helps businesses understand customer purchasing behavior. The formula to calculate AOV is: Average order value = total revenue/number of orders placed.
Let’s consider a hypothetical online store specializing in home goods. Over the past month, the business generated a total revenue of $50,000 from 1,000 orders.
Using the AOV formula, each order placed in the store was worth $50 on average. Understanding AOV allows the business to tailor marketing strategies, set promotional goals, and optimize pricing to enhance overall profitability.
Why is average order value important?
AOV is a helpful figure in a lot of ways. It’s particularly useful for sales forecasting. While not 100% accurate, looking at your historic AOV for specific months can give you a good idea of what your demand will be for the current year.
Businesses can also use the AOV to measure how well marketing efforts and pricing strategies are working, so they can take action to increase their AOV. Many small businesses find that increasing their AOV is a cost-effective way to improve their margins. What do we mean by this?
Well, it’s best to think of your sales in two stages. The first stage is increasing traffic. Typically, businesses try to increase traffic to their retail front through a number of means. For e-commerce stores, this can be ad campaigns, and brick-and-mortar stores might rent out nearby billboards.
The second stage is actually making the sale. It’s your business’s responsibility to make your products desirable to customers. You can accomplish this through quality, price, or a combination of multiple factors.
The distinction between these stages is that improving traffic incurs costs, but making sales doesn’t. As a result, it can be more lucrative to focus less on growing traffic and more on increasing your AOV.
What are the downsides of average order value?
AOV has a fatal flaw: it homogenizes data into a single figure. While sometimes it’s helpful to compress data into one data point, increasing sales often isn’t that simple. Sales depend on various factors, ranging from product quality and current trends to even the time of year.
It’s also worth noting that regarding sales forecasting, AOV’s usefulness tends to drop as products become more varied. Because the data point itself erases everything else about the sale except for the value, as product variation rises, relying too heavily on it can sometimes become a fatal flaw.
To be clear, however, AOV is still a very useful figure. It’s simple, easy to calculate, and can offer insights at a glance. The key takeaway here is that you should never rely solely on AOV. It’s just one of many figures to consider when making big business decisions.
What other metrics are there to consider?
Realistically, it’s best to consider as many data points as possible, and some of the most important ones include:
- Conversion rate: Your conversion rate is the number of people who purchase out of those who visit. It’s a bit more complex because it considers the number of web sessions, but it’s arguably the most important metric.
- Lifetime customer revenue: This metric is an estimation of how much a business can expect a customer to spend over the course of the business relationship. This takes into account the expected lifetime of the business.
- Customer acquisition cost: This handy metric calculates how much it costs to attract a customer’s business. Businesses calculate this figure alongside marketing campaigns to get as accurate a figure as possible.
- Returning customer rate: The number of customers who make more than a single purchase is known as the returning customer rate. This is a good indicator of product relevancy.
It’s important to understand which metrics are most useful to track for your business before investing in marketing efforts.
How can I increase my average order value?
There are a lot of ways to increase AOV, but it generally comes down to one of two things. Adding extra value for the customer or incentivizing more purchases through careful product placement. Here are some proven ways to increase your AOV.
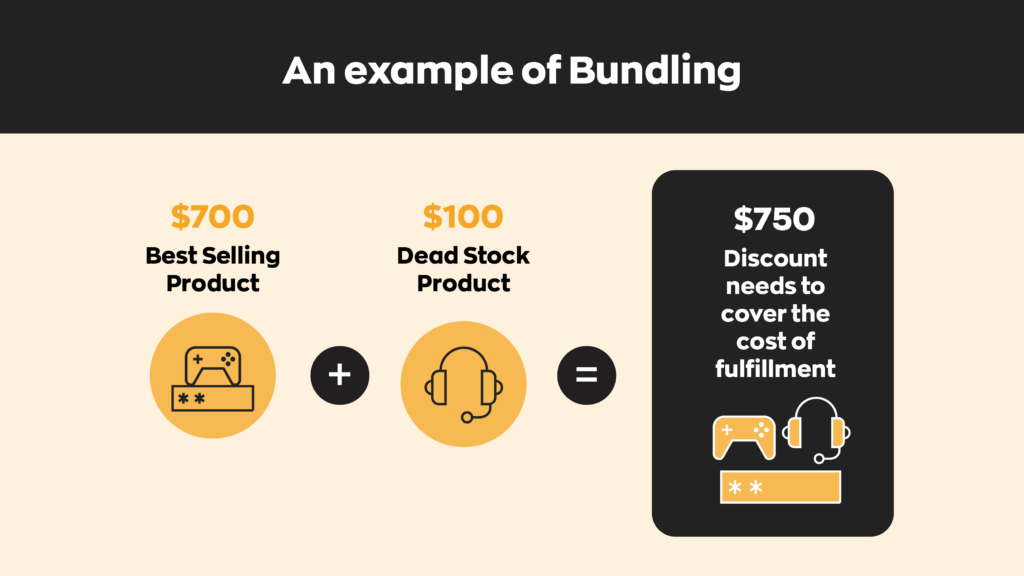
Bundle items together
Grouping products for sale is known as kitting and bundling, and it’s been around for decades. Think gift baskets, for example. Offering products that complement each other is a great way to persuade your existing customers to purchase items they may not have purchased otherwise. For instance, if someone buys a new computer, they’re more likely to purchase an accessory like a mouse. So why not bundle those two items together?ys a new computer, they’re more likely to purchase an accessory like a mouse. So why not bundle those two items together?
Implement a price threshold for free shipping
Let’s say your current AOV is $30. An easy way to increase it is by offering free shipping just barely above that threshold. For example, $35. If customers have the ability to save $10 or more on shipping, they have an incentive to spend the extra $5 to hit the threshold.
Create a customer loyalty program
One good way to keep customers coming back is to offer rewards for repeat business. These reward programs can also increase your AOV through promotional offers. Setting spending thresholds for customers to earn extra rewards could encourage them to put those additional items in their baskets or carts.
Upselling at checkout
What do overpriced candy bars, packs of gum, and the iconic phrase “Do you want fries with that?” have in common? Well, they’re all examples of upselling. For example, placing products near the checkout to try and increase sales is a tactic that brick-and-mortar retailers have used for ages. Today, we’re seeing e-commerce stores doing the same by showing shoppers items often purchased with the product in their cart. The idea is to offer your customers something they didn’t even know they needed.
Software and tools
AOV itself is easy enough to calculate. The trouble comes when trying to gather all the necessary data. If you’re tracking your sales and purchases using a pen and paper, you’ll have your work cut out for you.
Many different types of software and tools can simplify the calculation of AOV and related tasks. For example, various analytics tools provide comprehensive insights into AOV by analyzing customer purchasing patterns and segmenting data.
Meanwhile, inventory tracking software can further enhance these efforts by ensuring stock levels align with demand forecasts derived from AOV analysis. These tools offer real-time inventory updates and sales reports, allowing businesses to keep track of product availability and avoid overstocking or stockouts, thereby aligning inventory management strategies with sales performance metrics.
Overall, leveraging a combination of analytical and inventory management software helps businesses optimize their sales strategies, improve customer satisfaction, and enhance profit margins by efficiently managing both customer transactions and inventory levels.

Absolutely loved this detailed guide! Your insights into Average Order Value (AOV) and effective marketing strategies like free shipping and product bundling really add value